What does the Revenue Management Board offer?
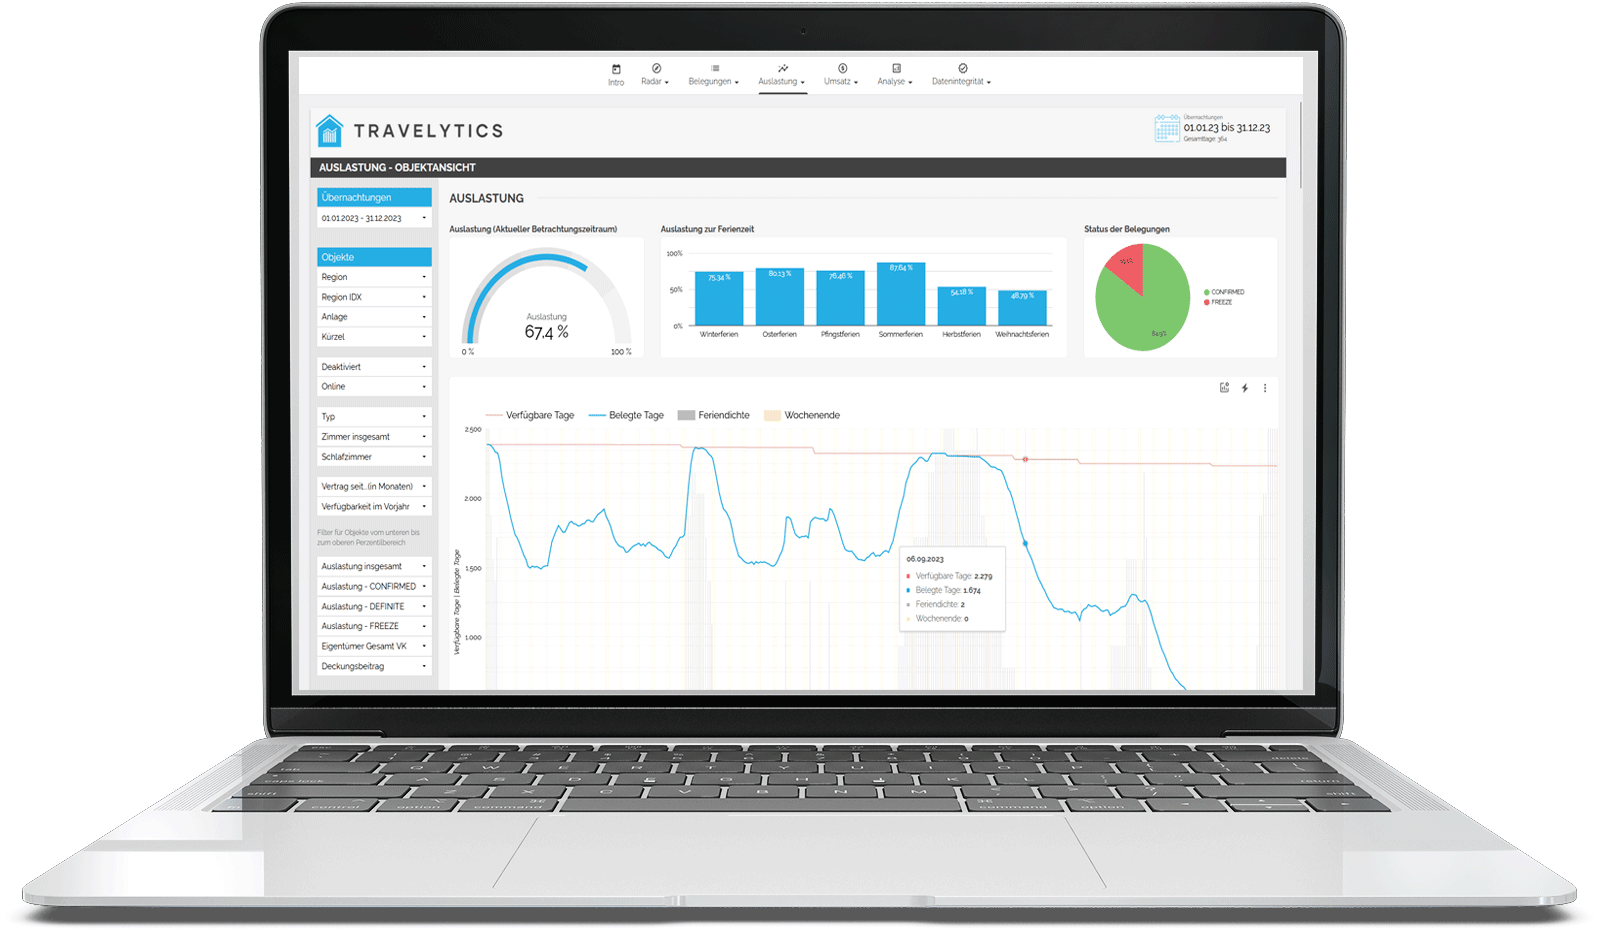
The Travelytics Revenue Management Board displays all relevant metrics needed for optimized pricing, occupancy forecasts, and strategic decisions. With just a few clicks, all important metrics from your Property Management System (PMS) are analyzed and prepared.
If you would like to test our dashboard with demo data or real data, please contact us.
Are you ready to increase your revenue?
ODo you want to increase your revenue and unlock the full potential of your vacation rental agency? Let's work together to create your success story!
Get a free demo accessINTRO AND RADAR
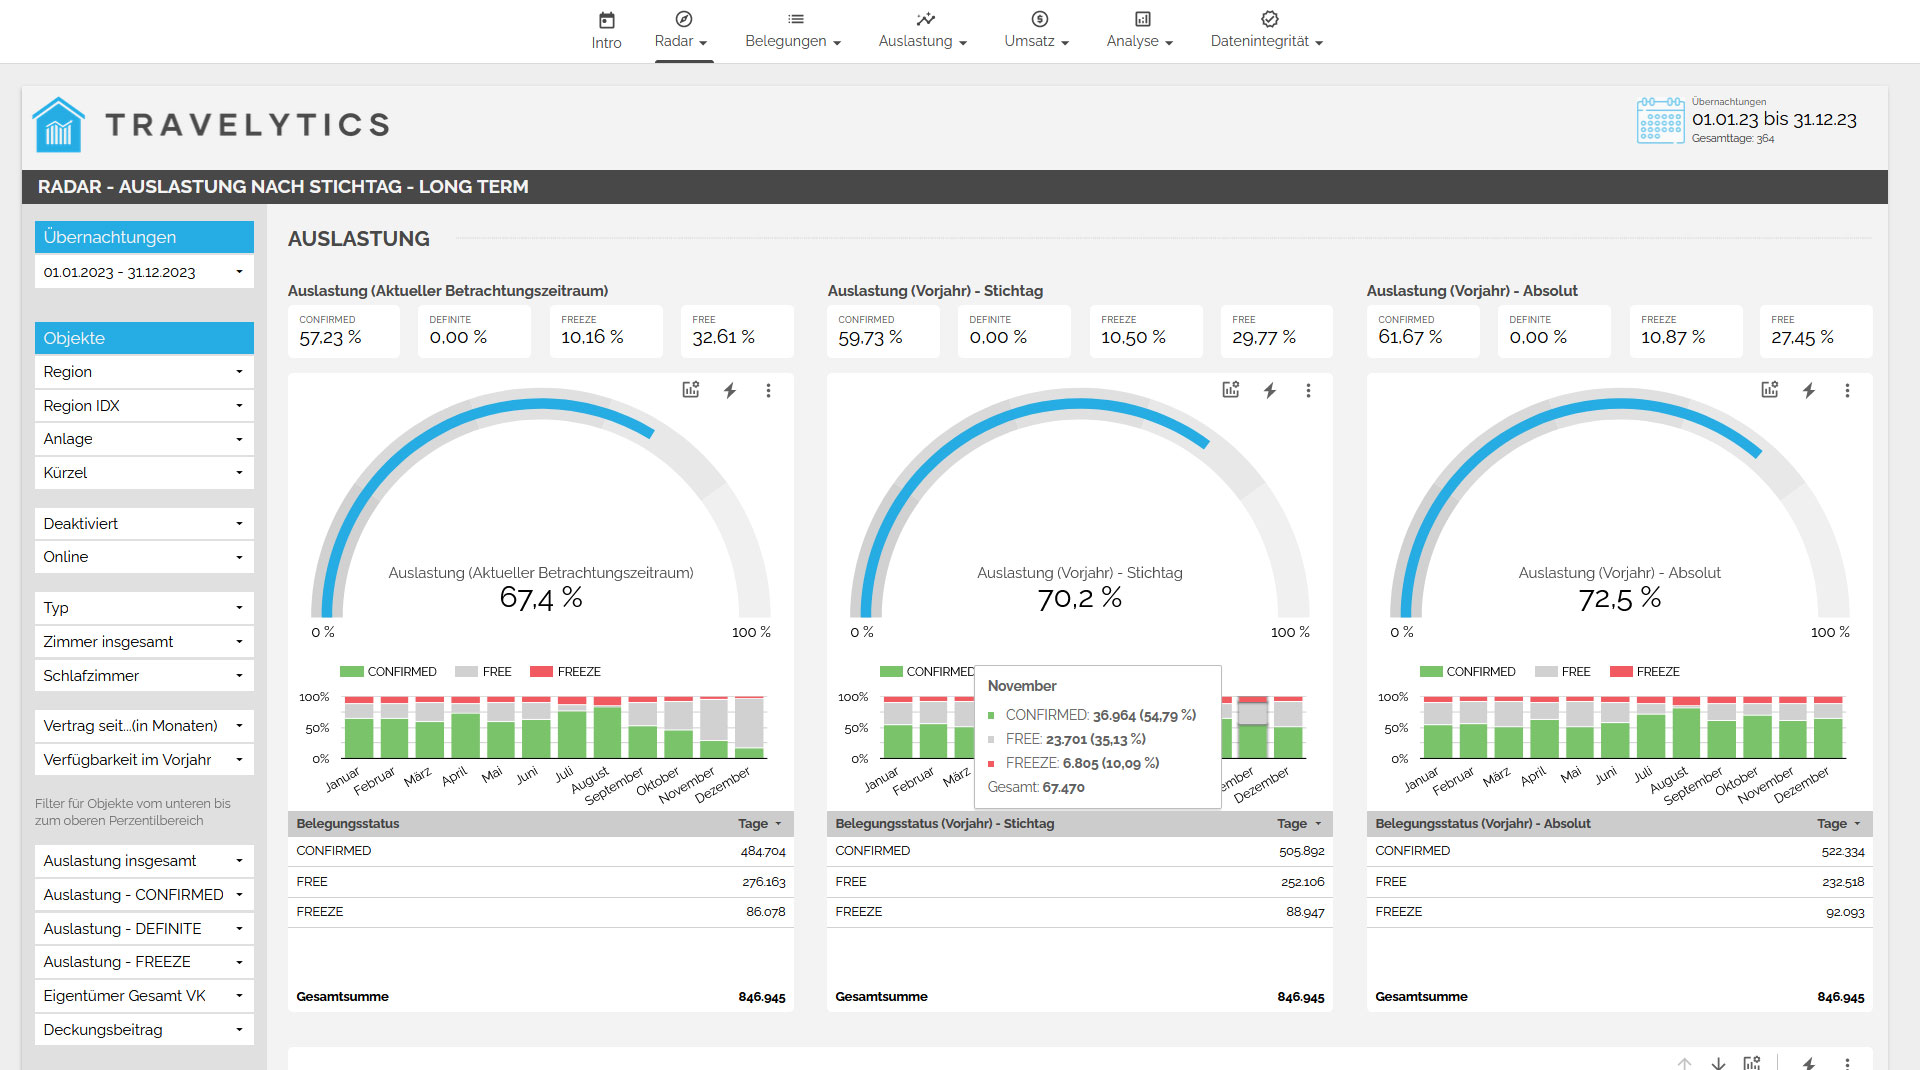
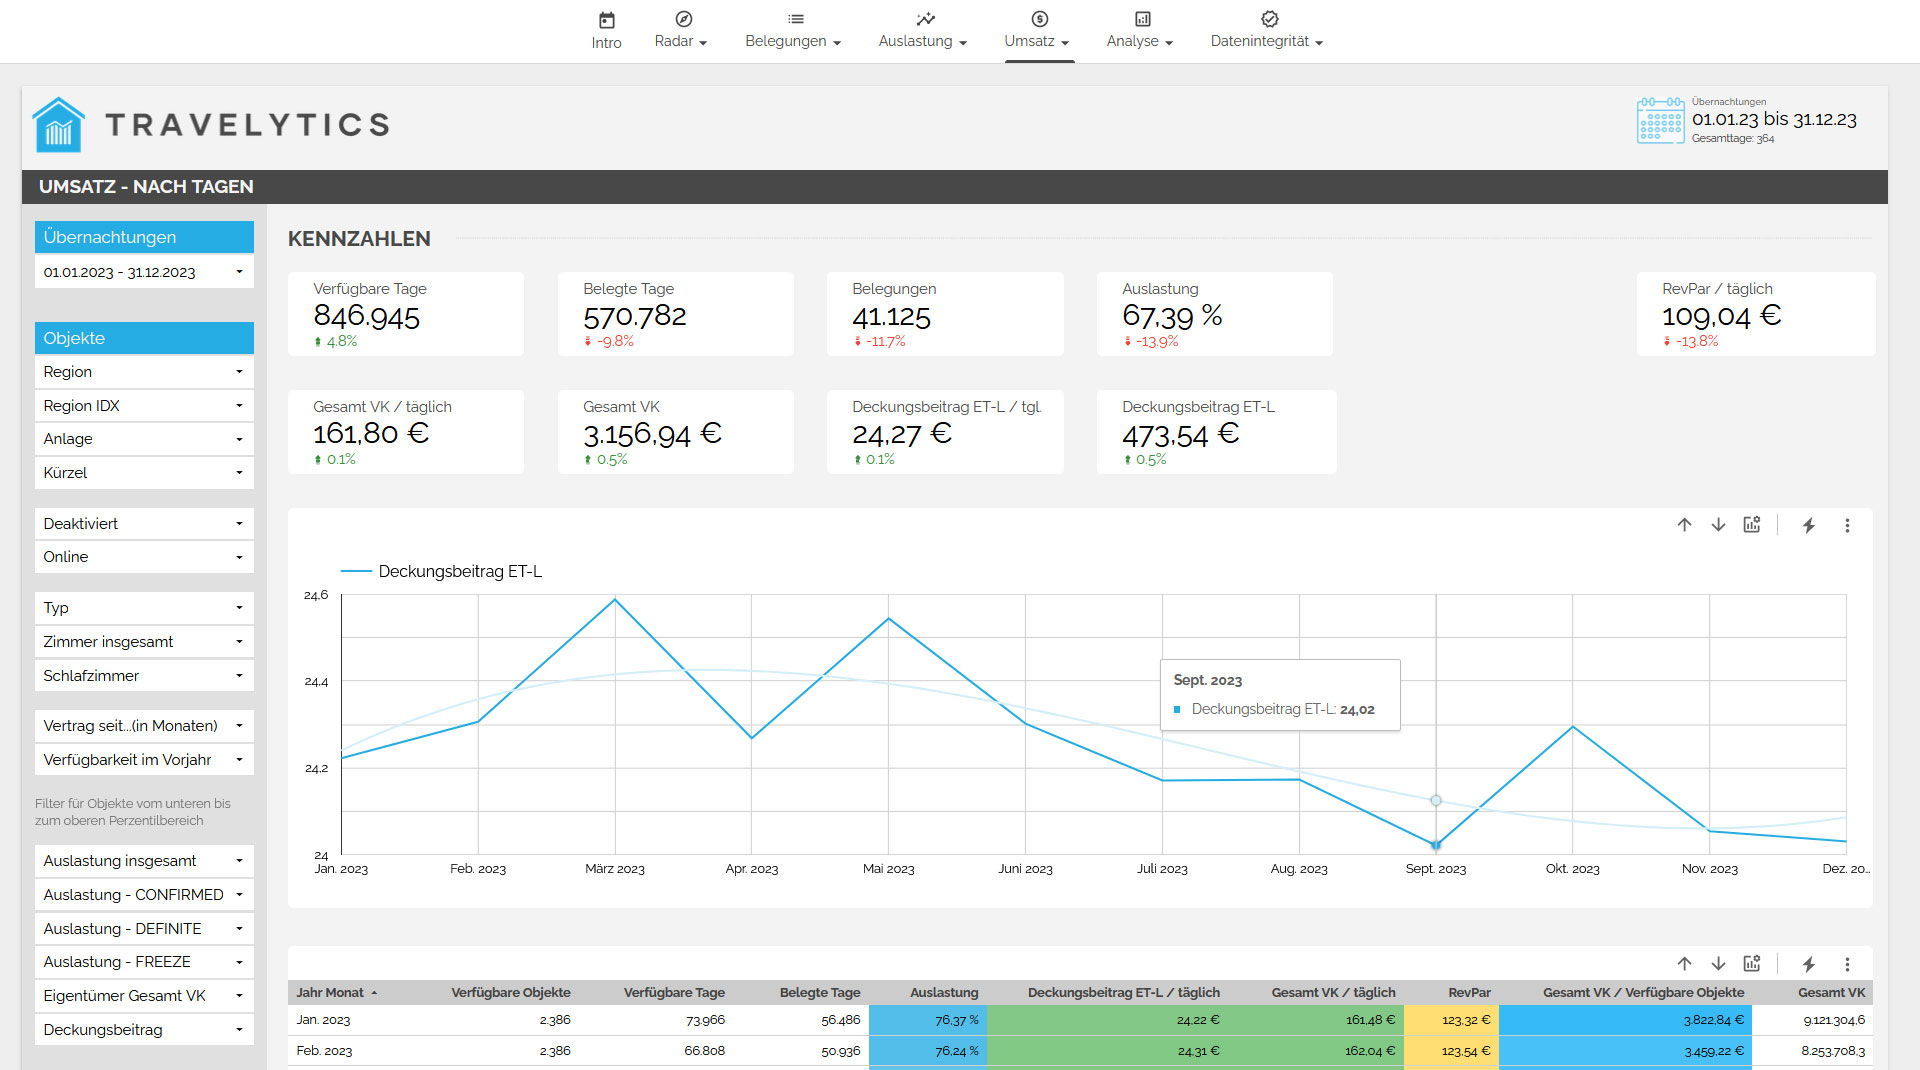
Comparison to the previous year
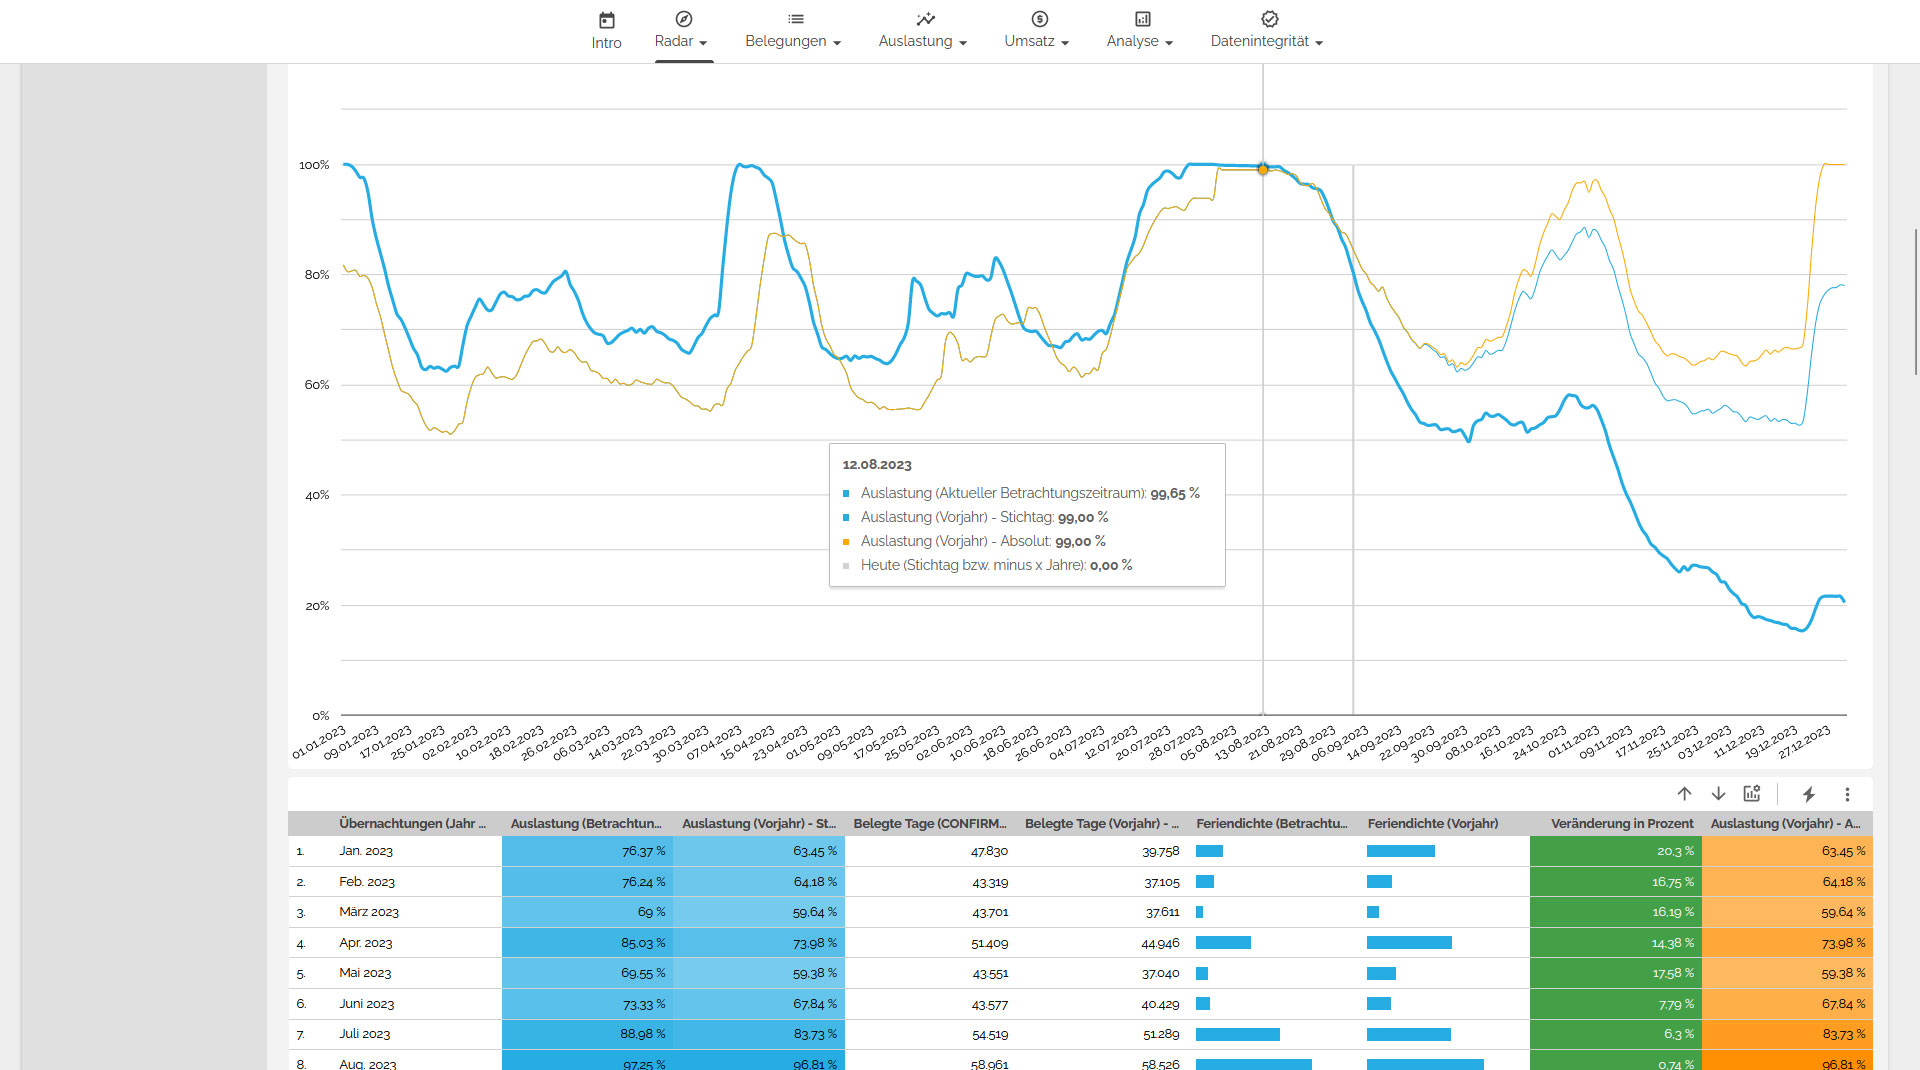
Let's start with a comprehensive overview of the current key performance indicators and compare them with the previous year, both on the specified date and in absolute terms. Here, you can view a detailed breakdown by days, weeks, and months, and use the filtering options to segment the data by sales channels, assets, individual accommodations, and much more. This will provide you with a clear understanding of your occupancy levels, enabling you to adjust prices, modify booking conditions, or adapt your marketing strategy accordingly.
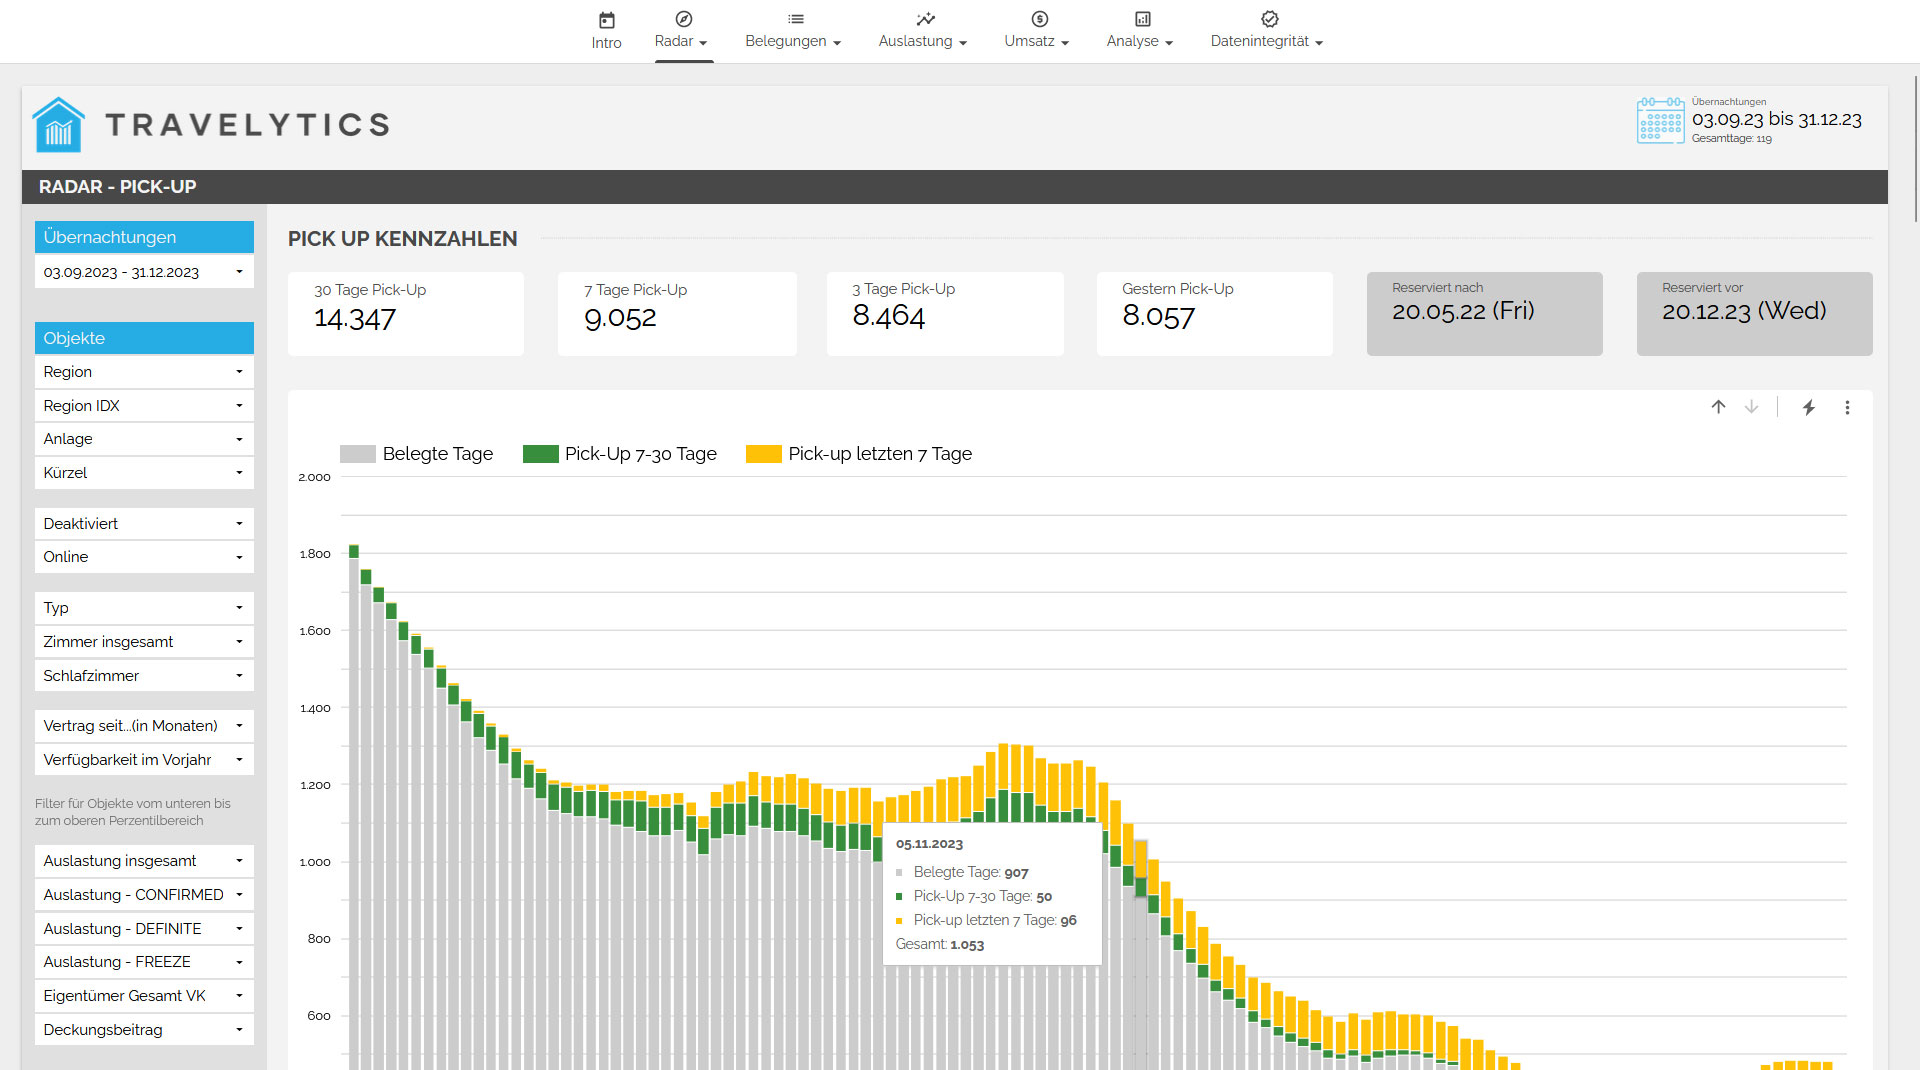
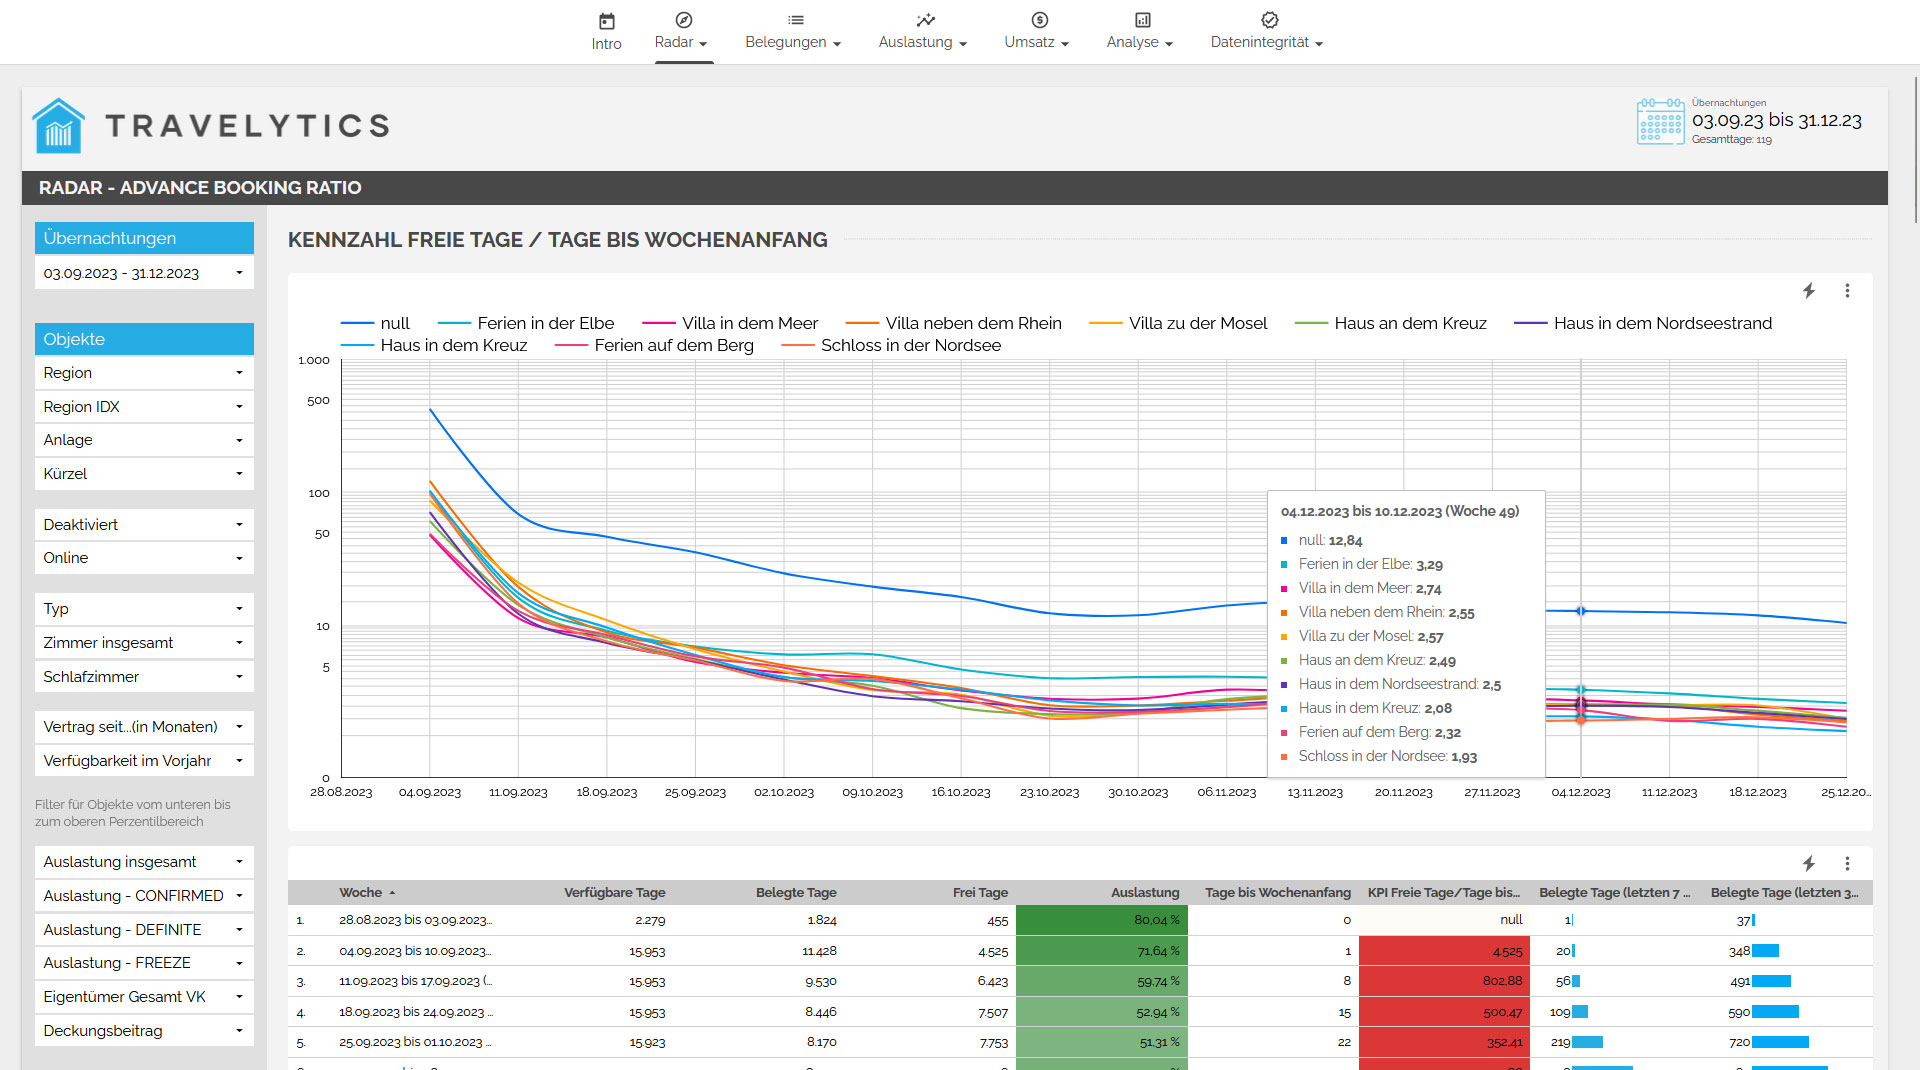
Pick Up
The pickup provides an overview of the future booking trends and shows how many days within a specific time frame have already been booked for the future. This allows you to identify booking velocity and quickly identify patterns. For example, you can determine if there has been an increased number of bookings for a particular period in the last few days. This way, you can immediately adjust your marketing strategies or even modify prices accordingly.
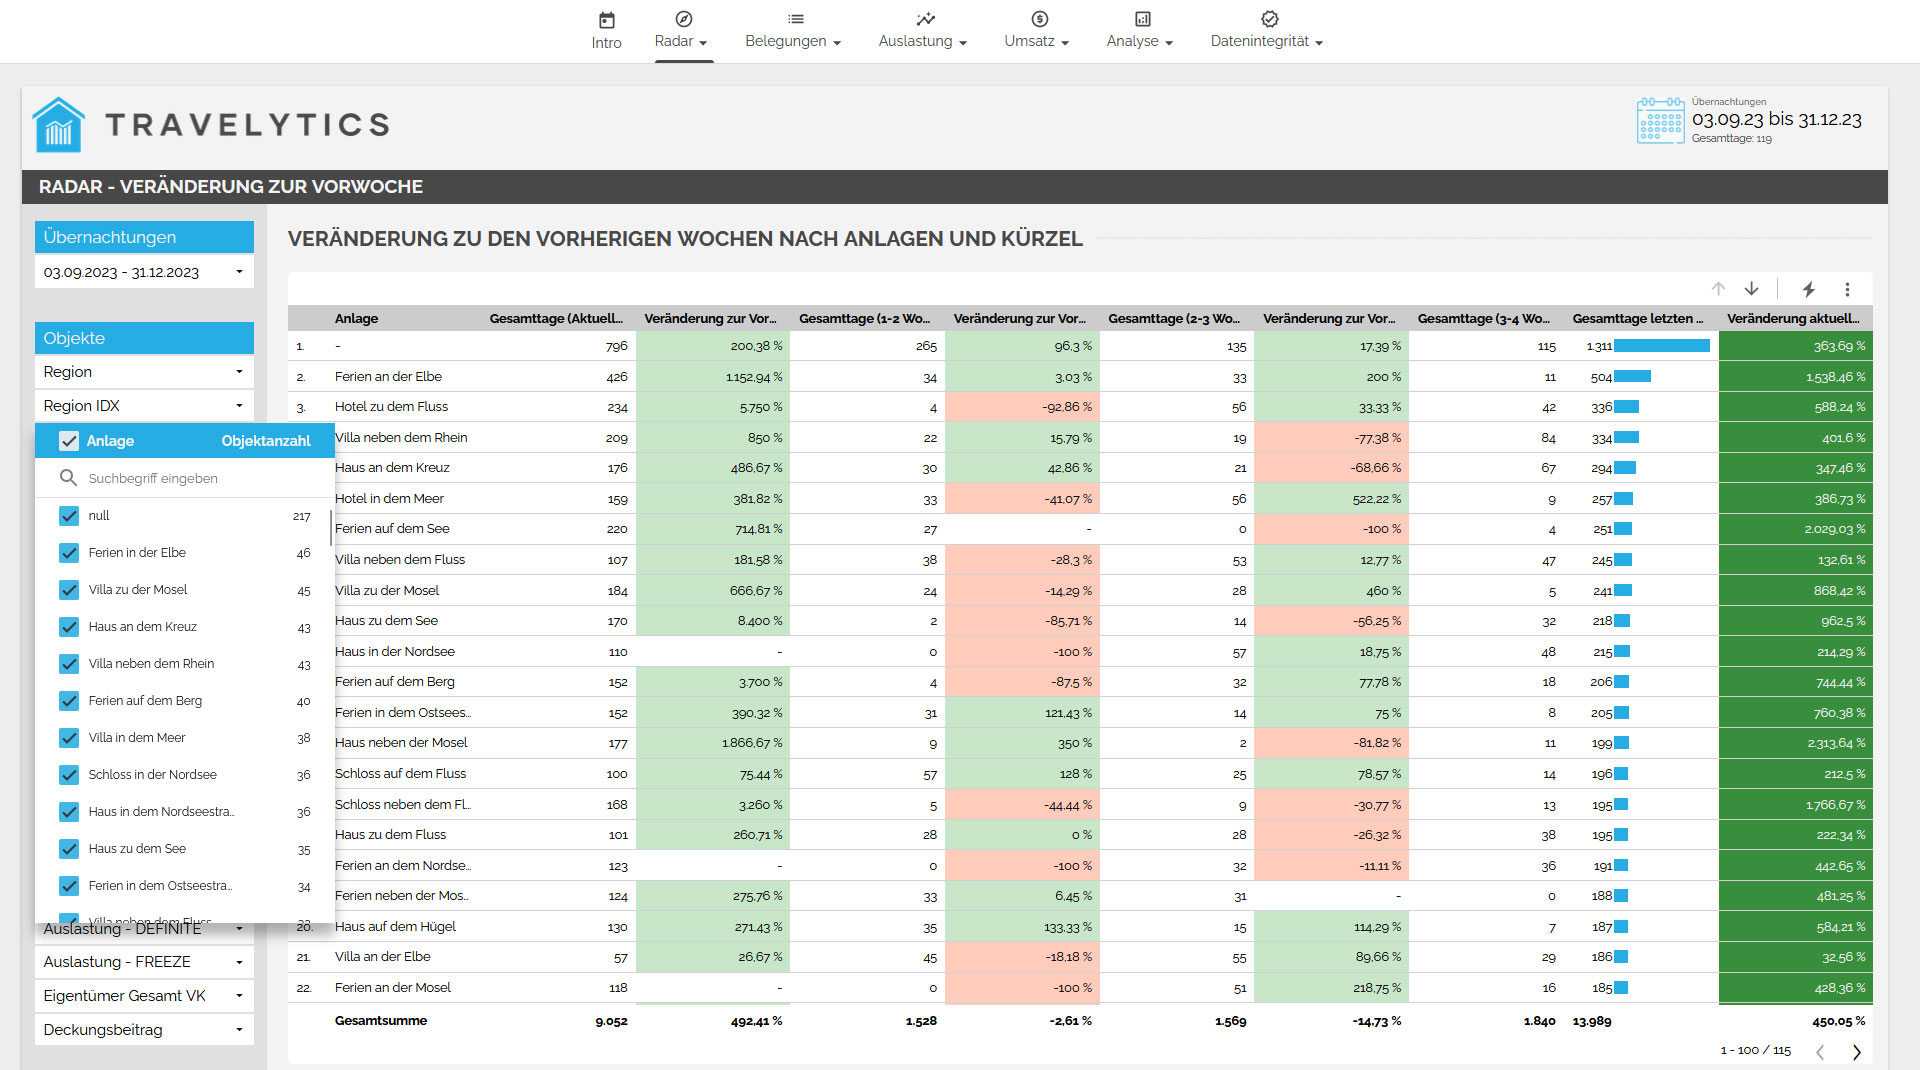
Weekly overview
In the weekly overview, we show you how the rental of accommodations is developing in the upcoming weeks and whether there is any need for action. You can also determine if there are fewer bookings coming through specific sales channels or if certain assets are being booked more frequently. This allows you to react directly and take appropriate measures accordingly.
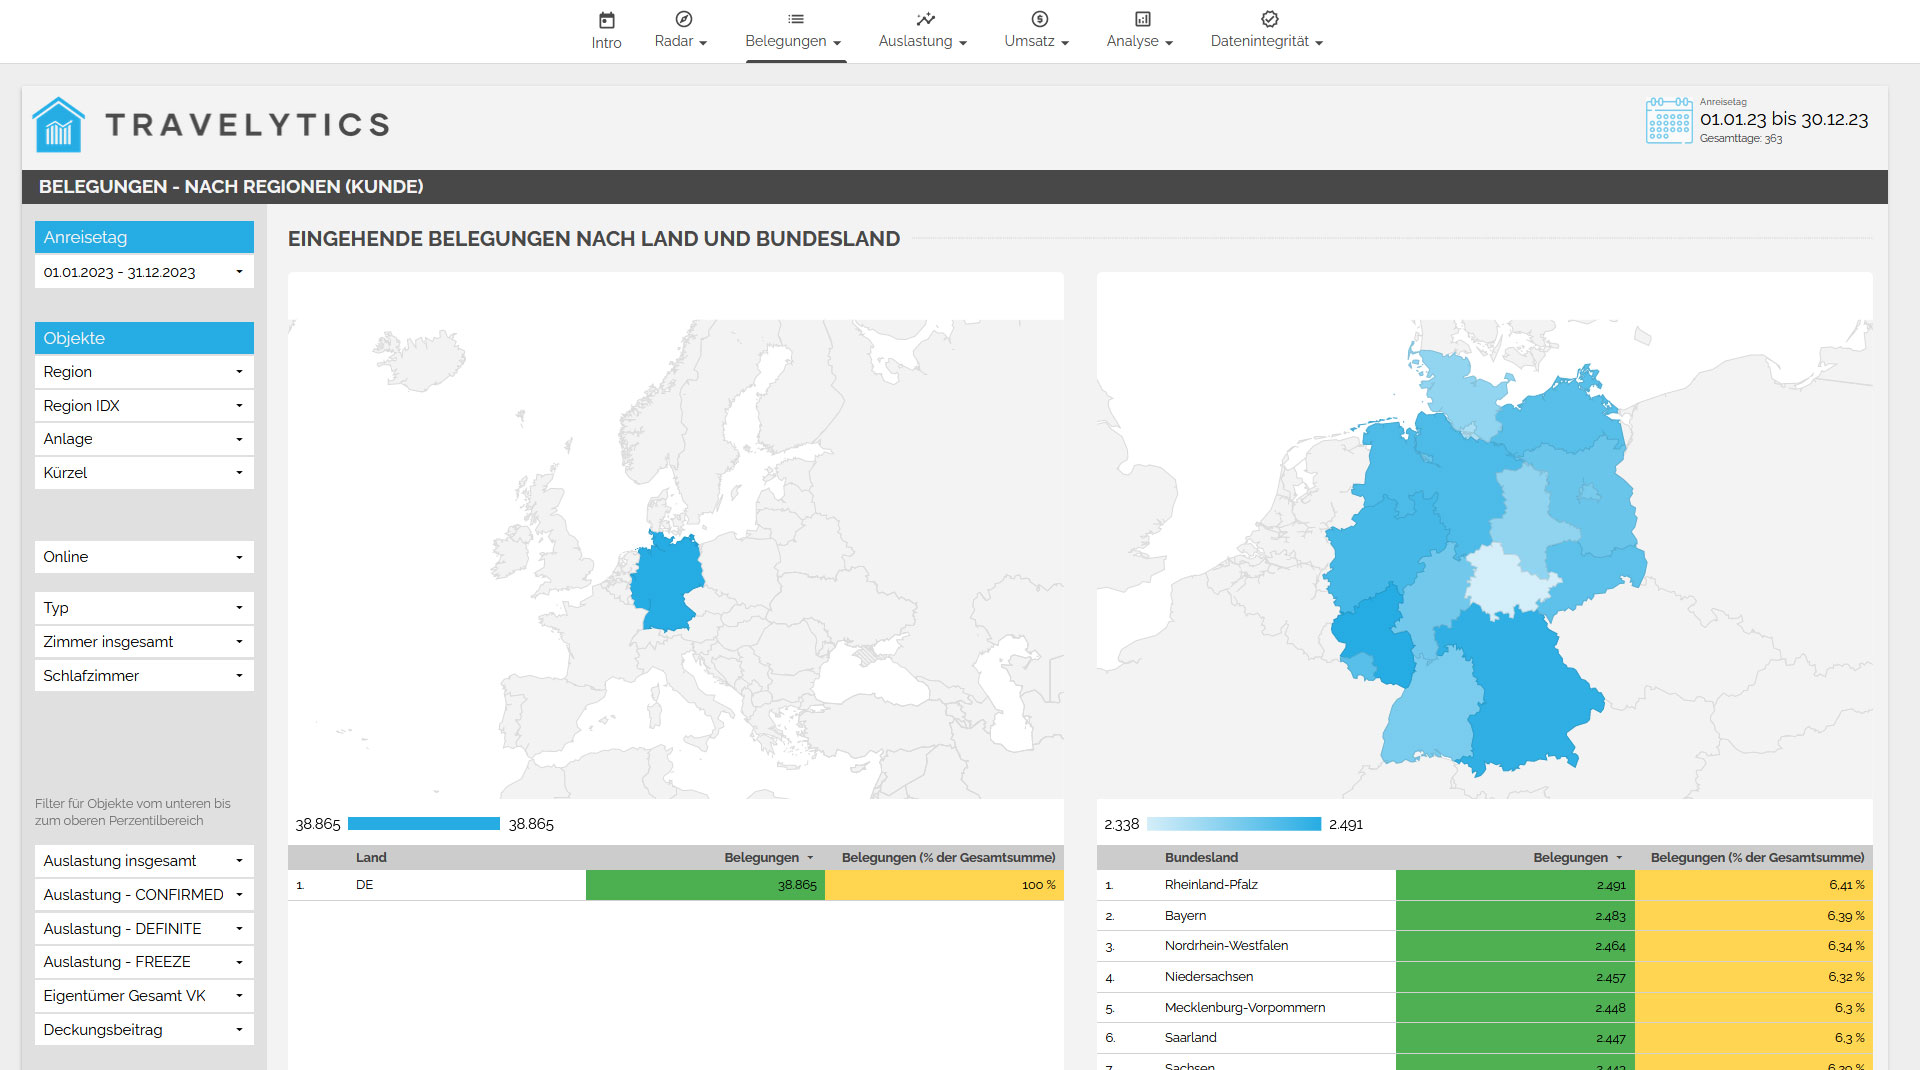
TARGET GROUP
One essential component of your revenue management is a profound understanding of your customers. Therefore, we provide you with comprehensive information about your occupancy. This includes answering questions such as:
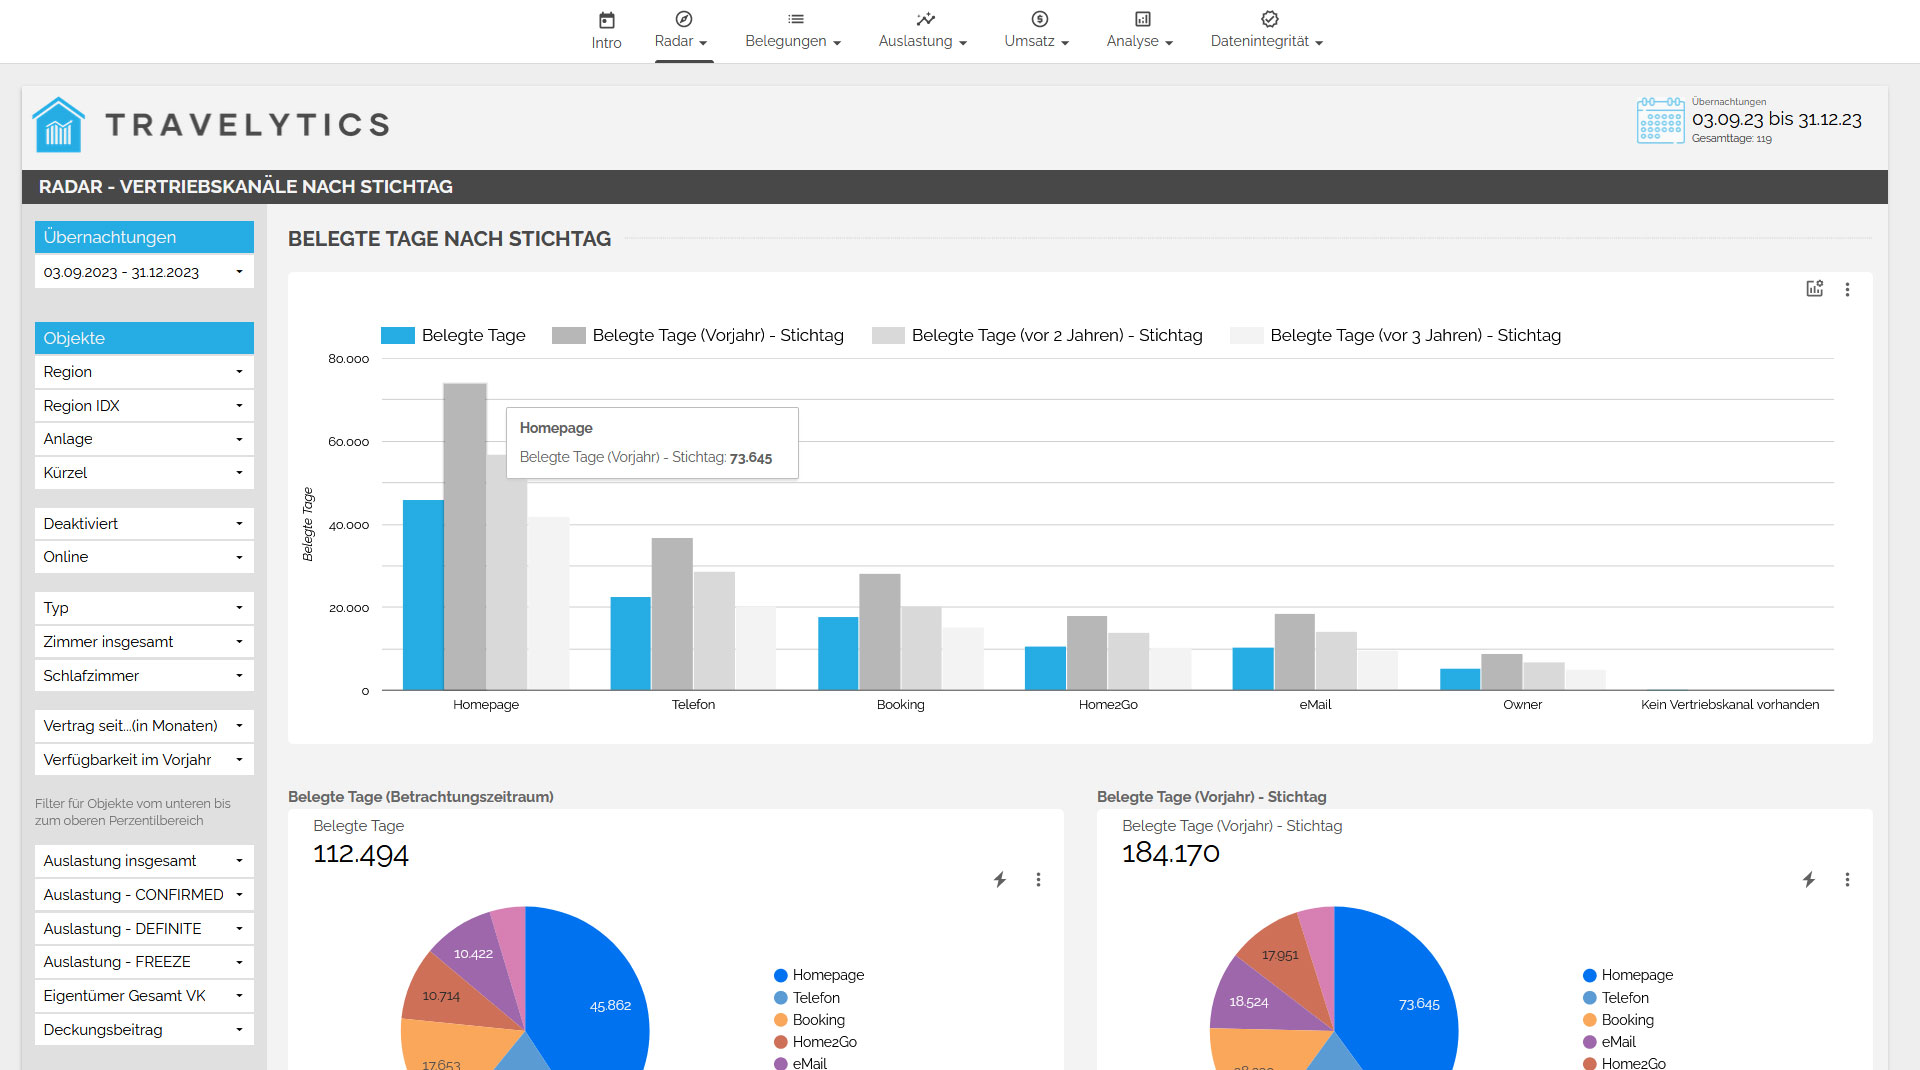
- Where does the customer come from?
- Through which channels does the customer make bookings?
- What type of accommodation does the customer book?
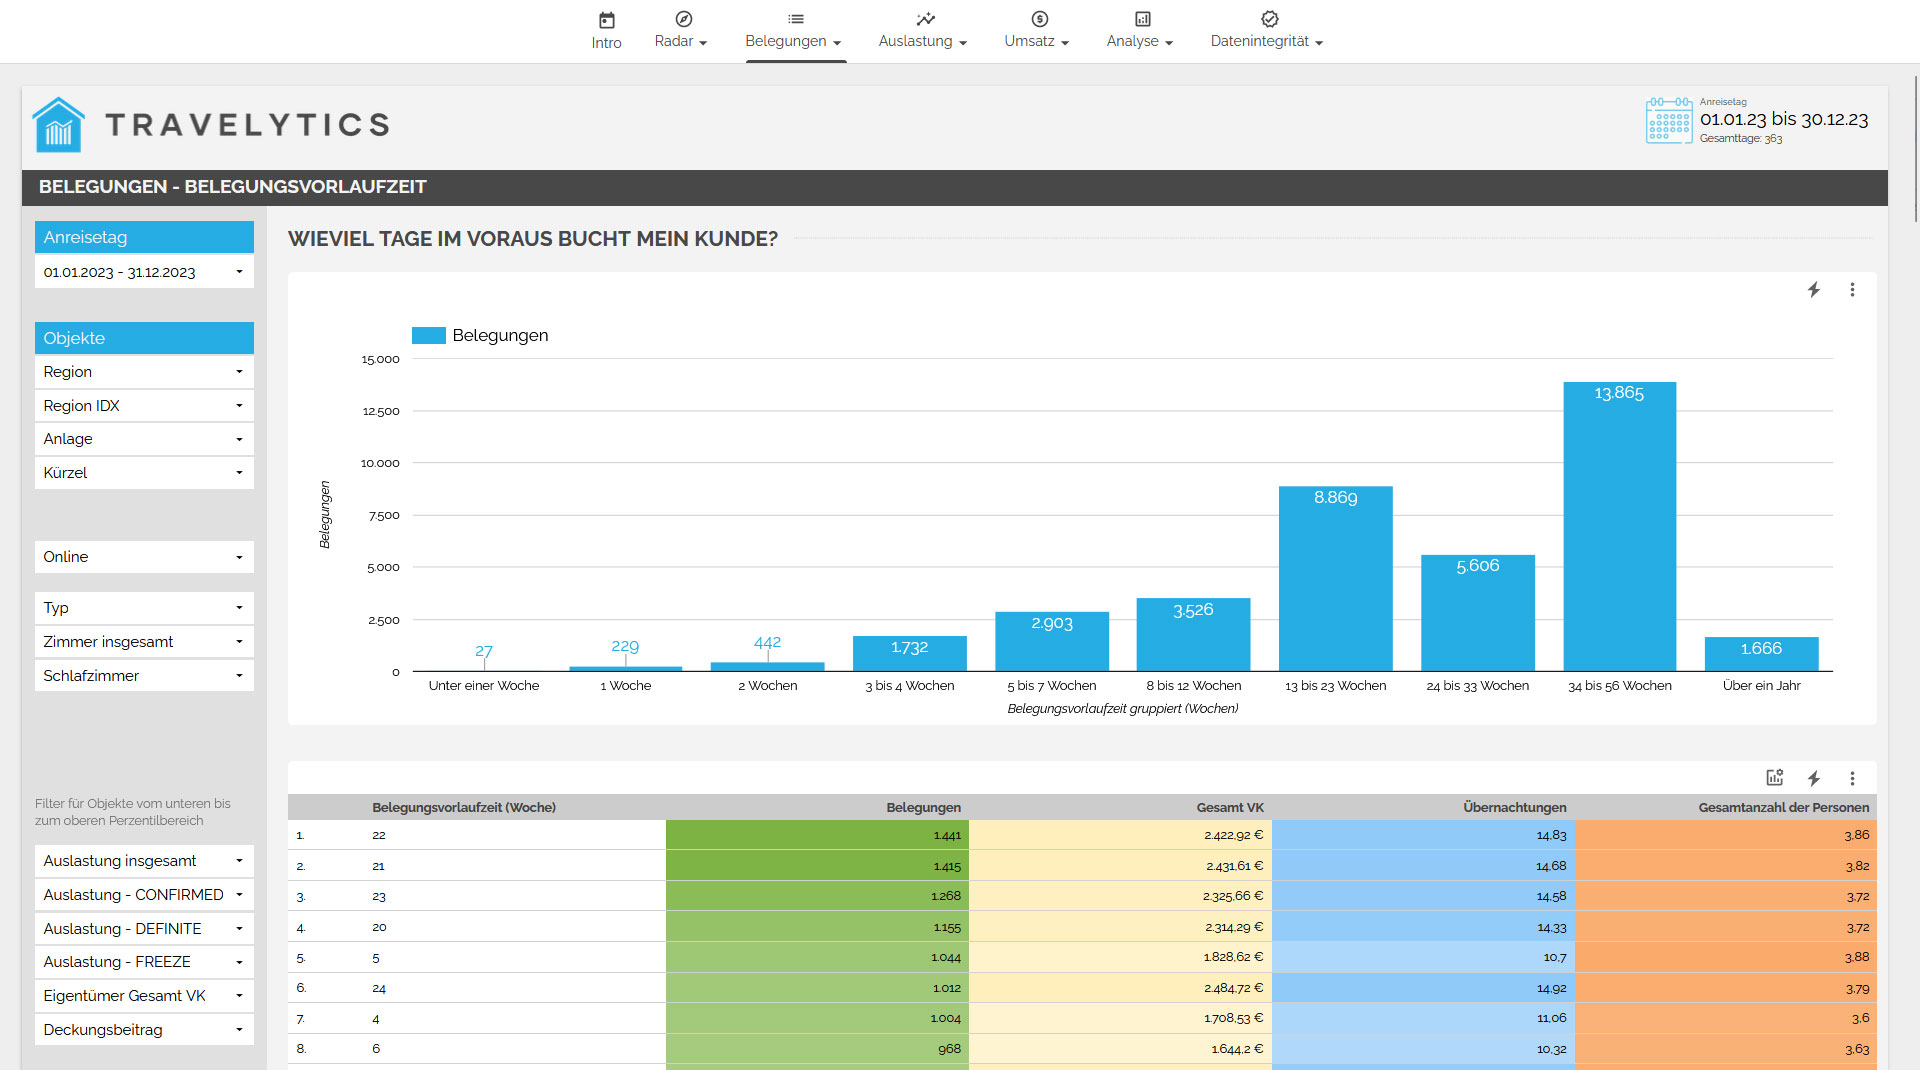
- How far in advance does the customer make the booking?
- How long does the customer plan to stay in the accommodations?
- How many people will be staying in the accommodations at any given time?
- When do families, couples, or larger groups typically make their bookings?
The answers to these and other questions will help you better understand future demands. By analyzing the booking patterns of your customers, you can align and optimize your business strategies more effectively.
OCCUPATION
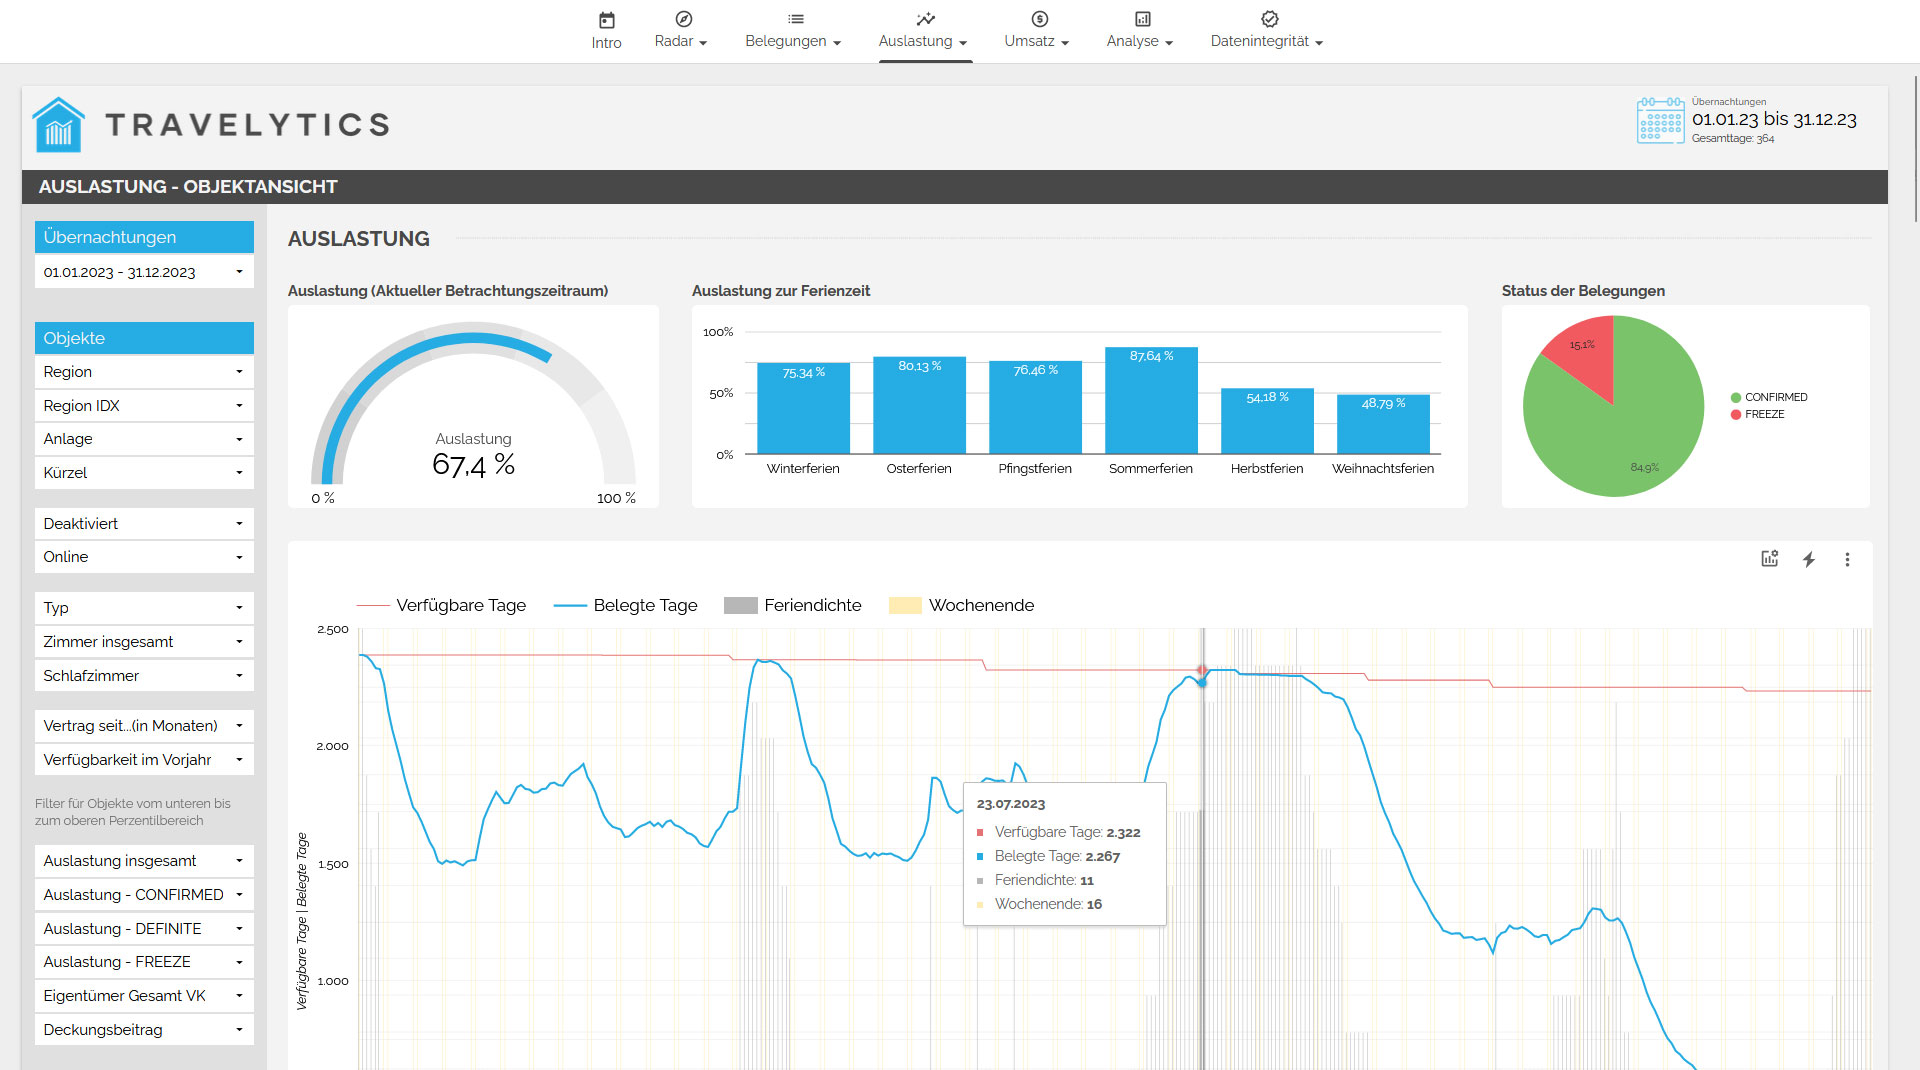
Occupancy Rate
The occupancy rate is one of the most critical indicators for vacation rental agencies. A low occupancy rate cannot be compensated for by additional bookings since only a limited number of accommodations are available. To provide you with a comprehensive overview, we present information on past, current, and future occupancy rates, which can be filtered based on various parameters.
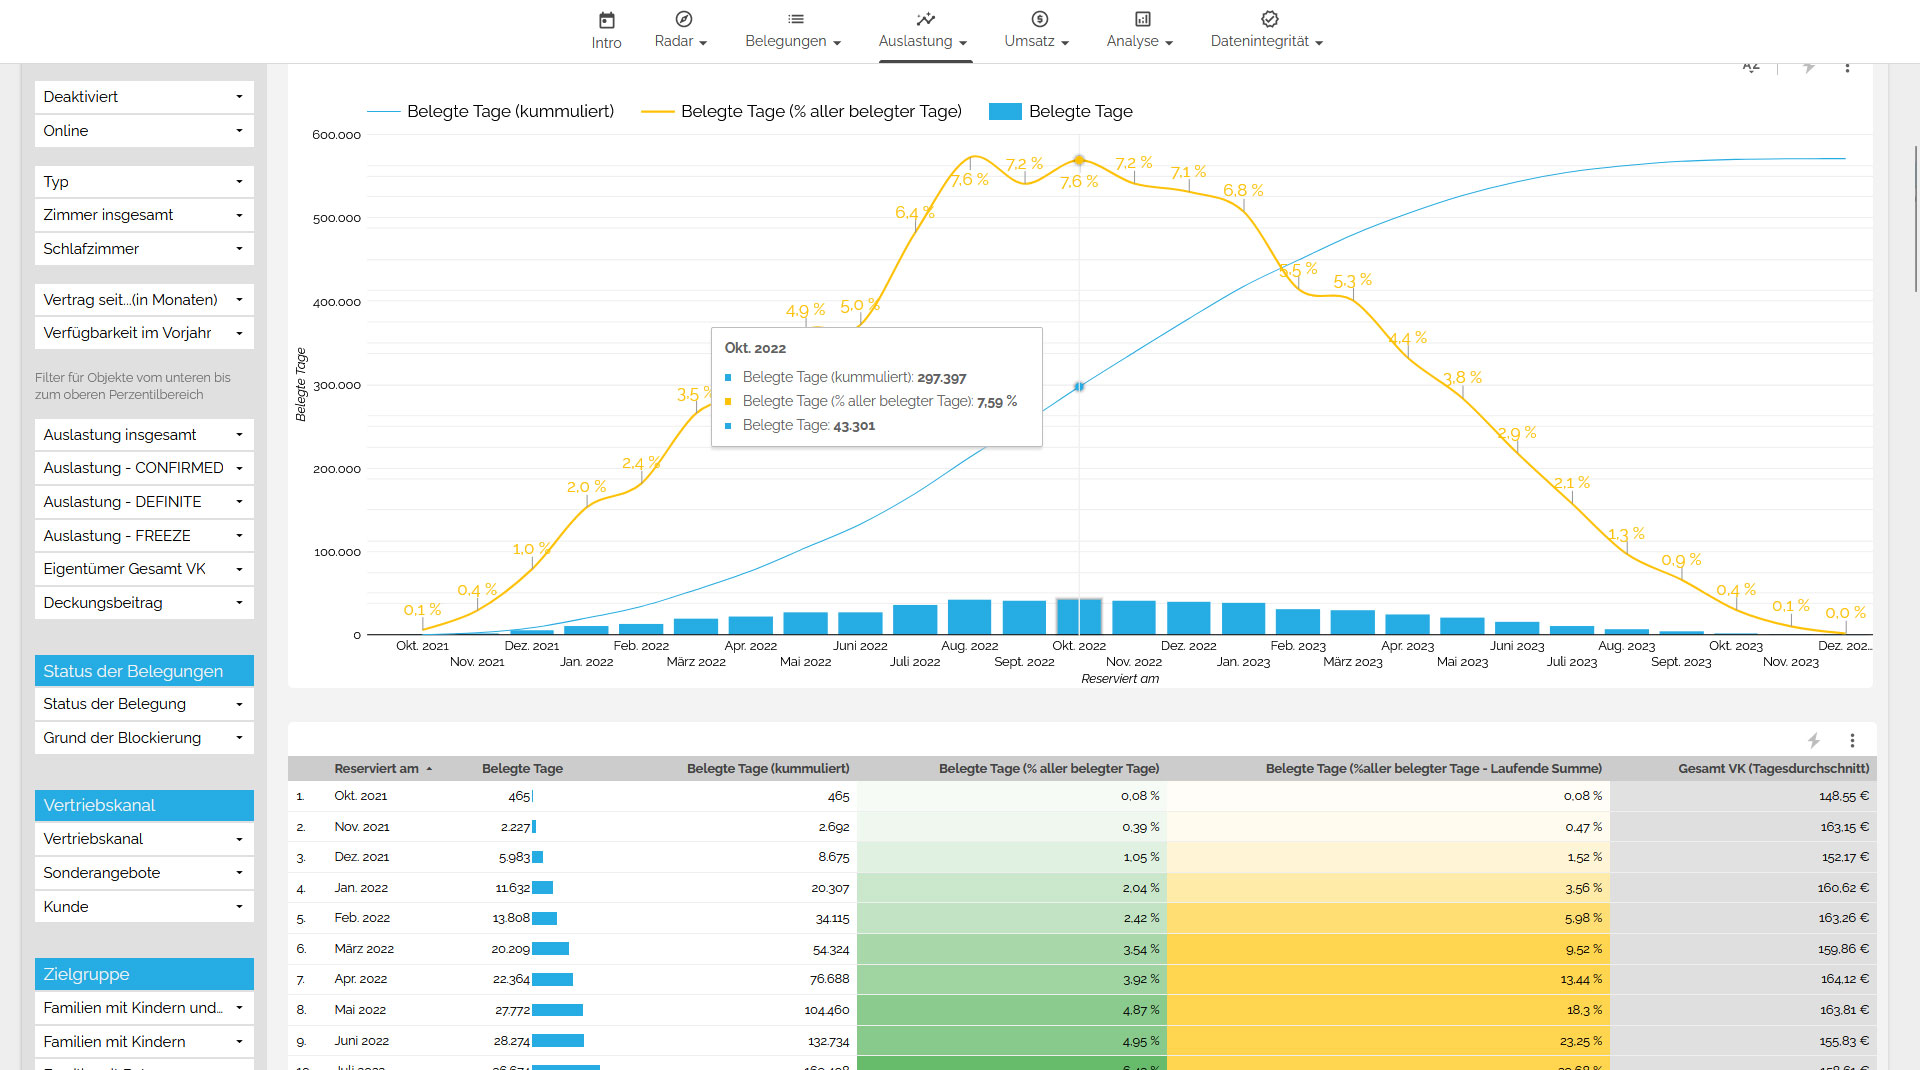
Booking Velocity
In the next step, we examine the temporal development of the occupancy, including booking patterns and the timing of bookings before the arrival date. It is essential to interpret the results to derive actionable insights. This analysis also considers other factors, such as vacation periods in different countries, which can influence the occupancy rate.
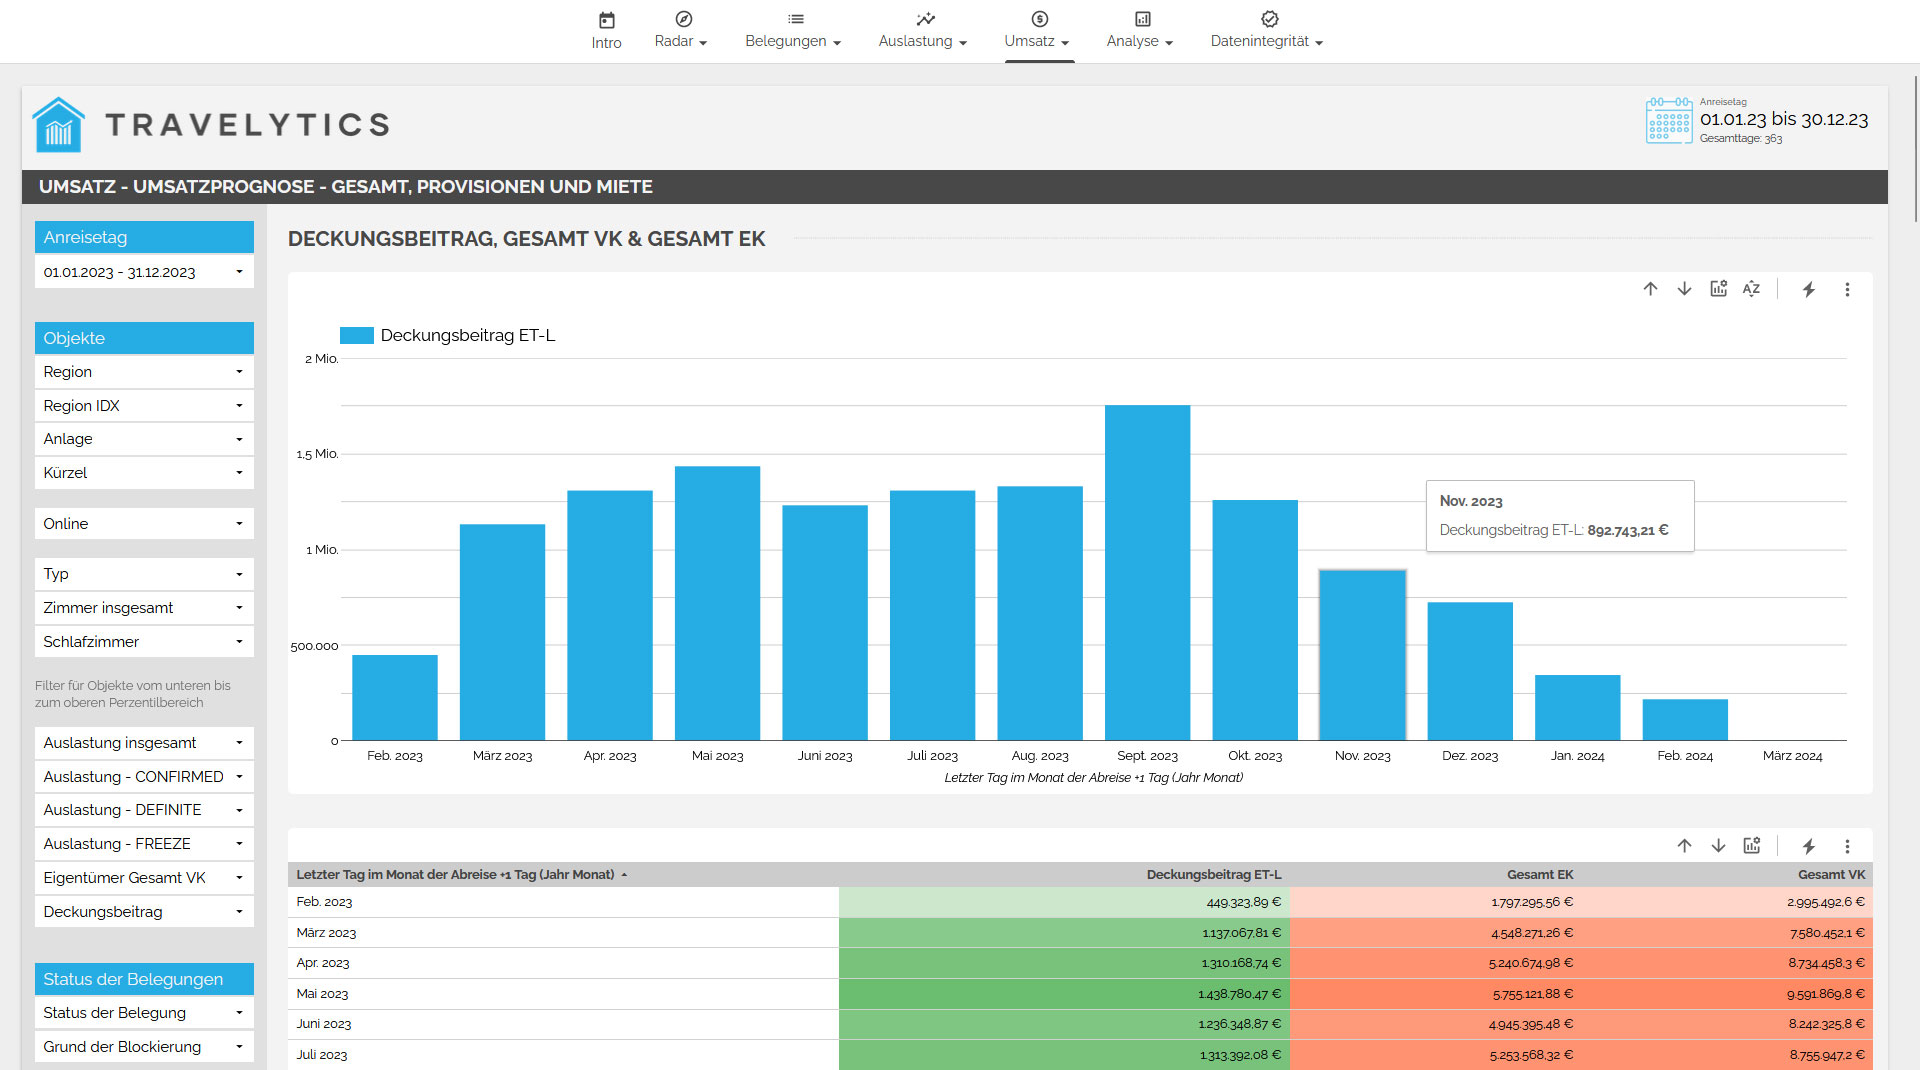
REVENUE
Forecasting
Here, we present you with a forecast of the expected revenue, broken down into various performance categories such as rental fees, utilities, final cleaning, bed linen, and more. At a glance, you can see the revenue you can expect in the upcoming months. You can also use numerous filters to further specify the data.
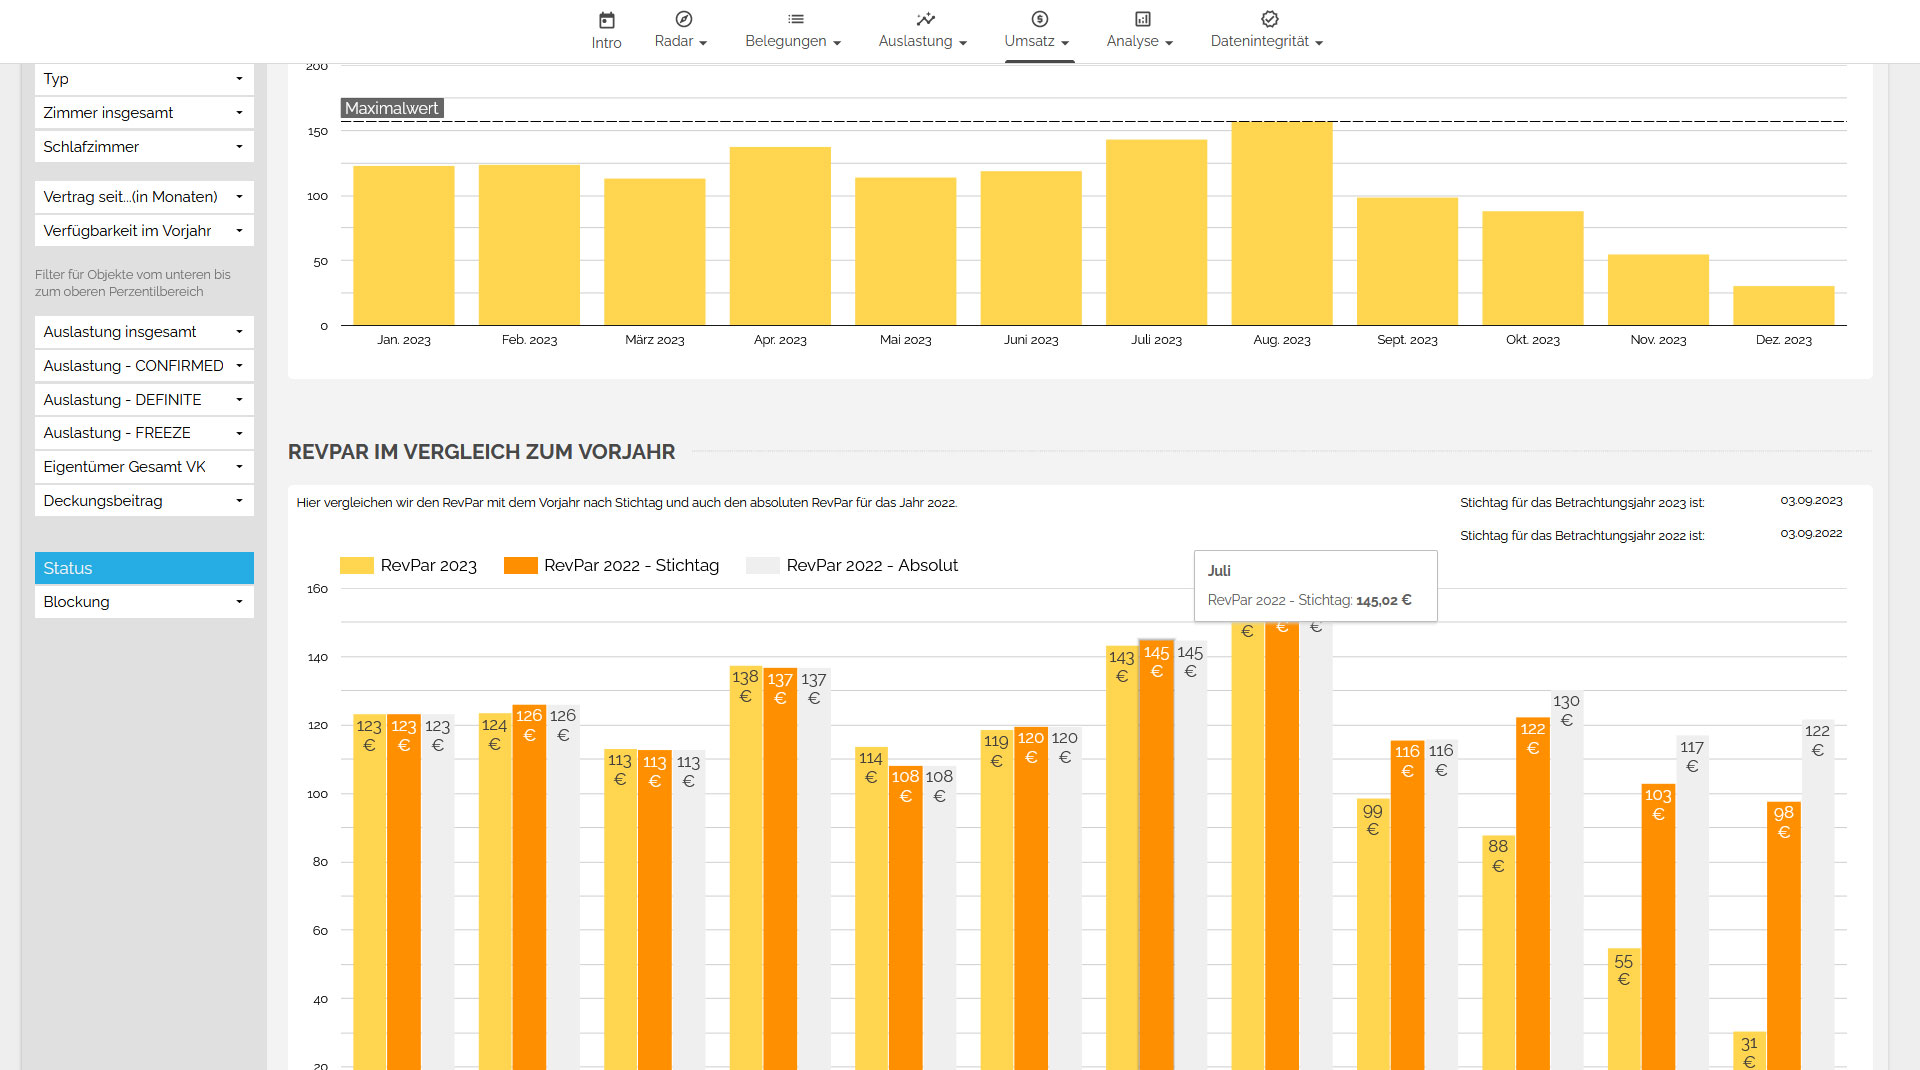
RevPAR
For a vacation rental agency, RevPAR (Revenue per Available Room) represents the average revenue the agency generates per available accommodation. This revenue is calculated by dividing the total revenue by the number of available accommodations. This way, you always have an eye on the RevPAR, both compared to the previous year on the specified date and for the upcoming months. The RevPAR can be improved by increasing occupancy or raising prices.
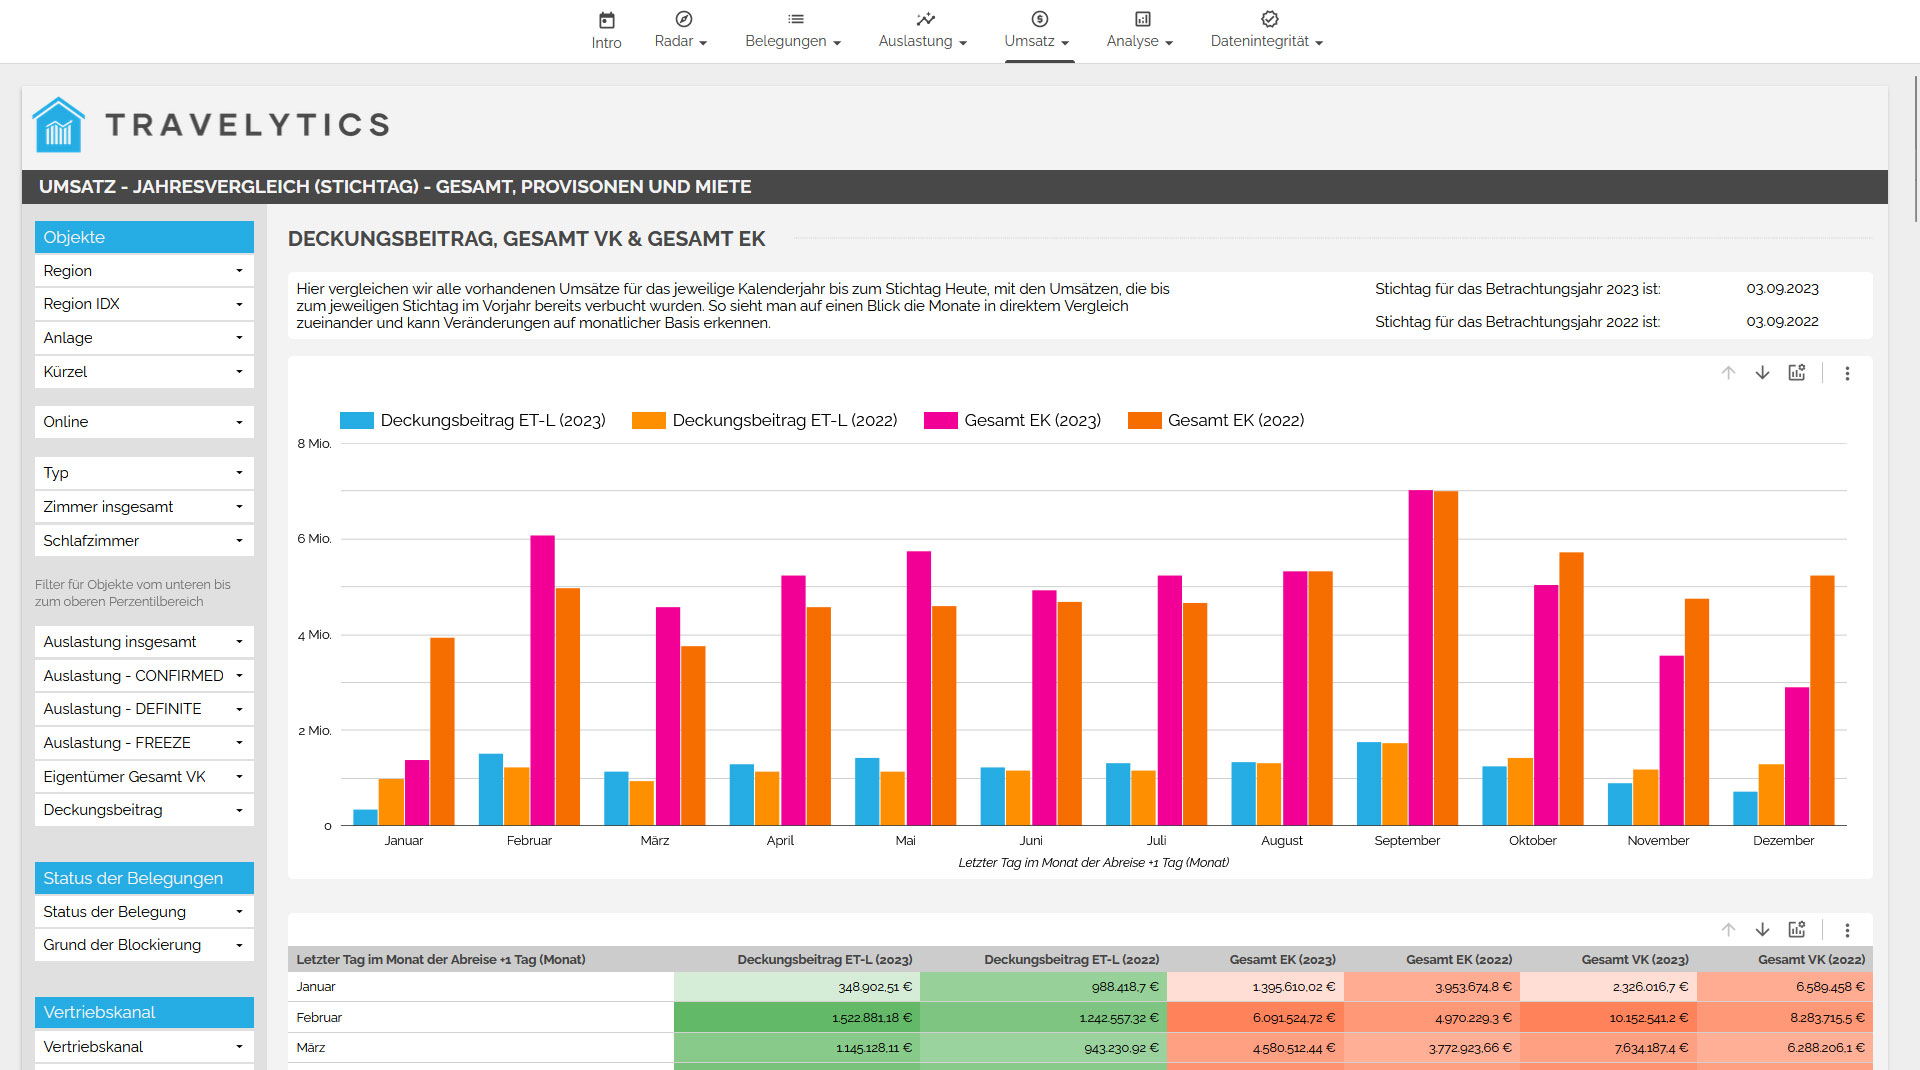
Revenue Comparison to the Previous Year
Furthermore, we provide you with a direct comparison of the revenue to the previous year. This gives you an up-to-date overview of your revenue compared to the previous year, including all different performance categories such as rental fees, utilities, final cleaning, bed linen, and more.
ANALYSIS
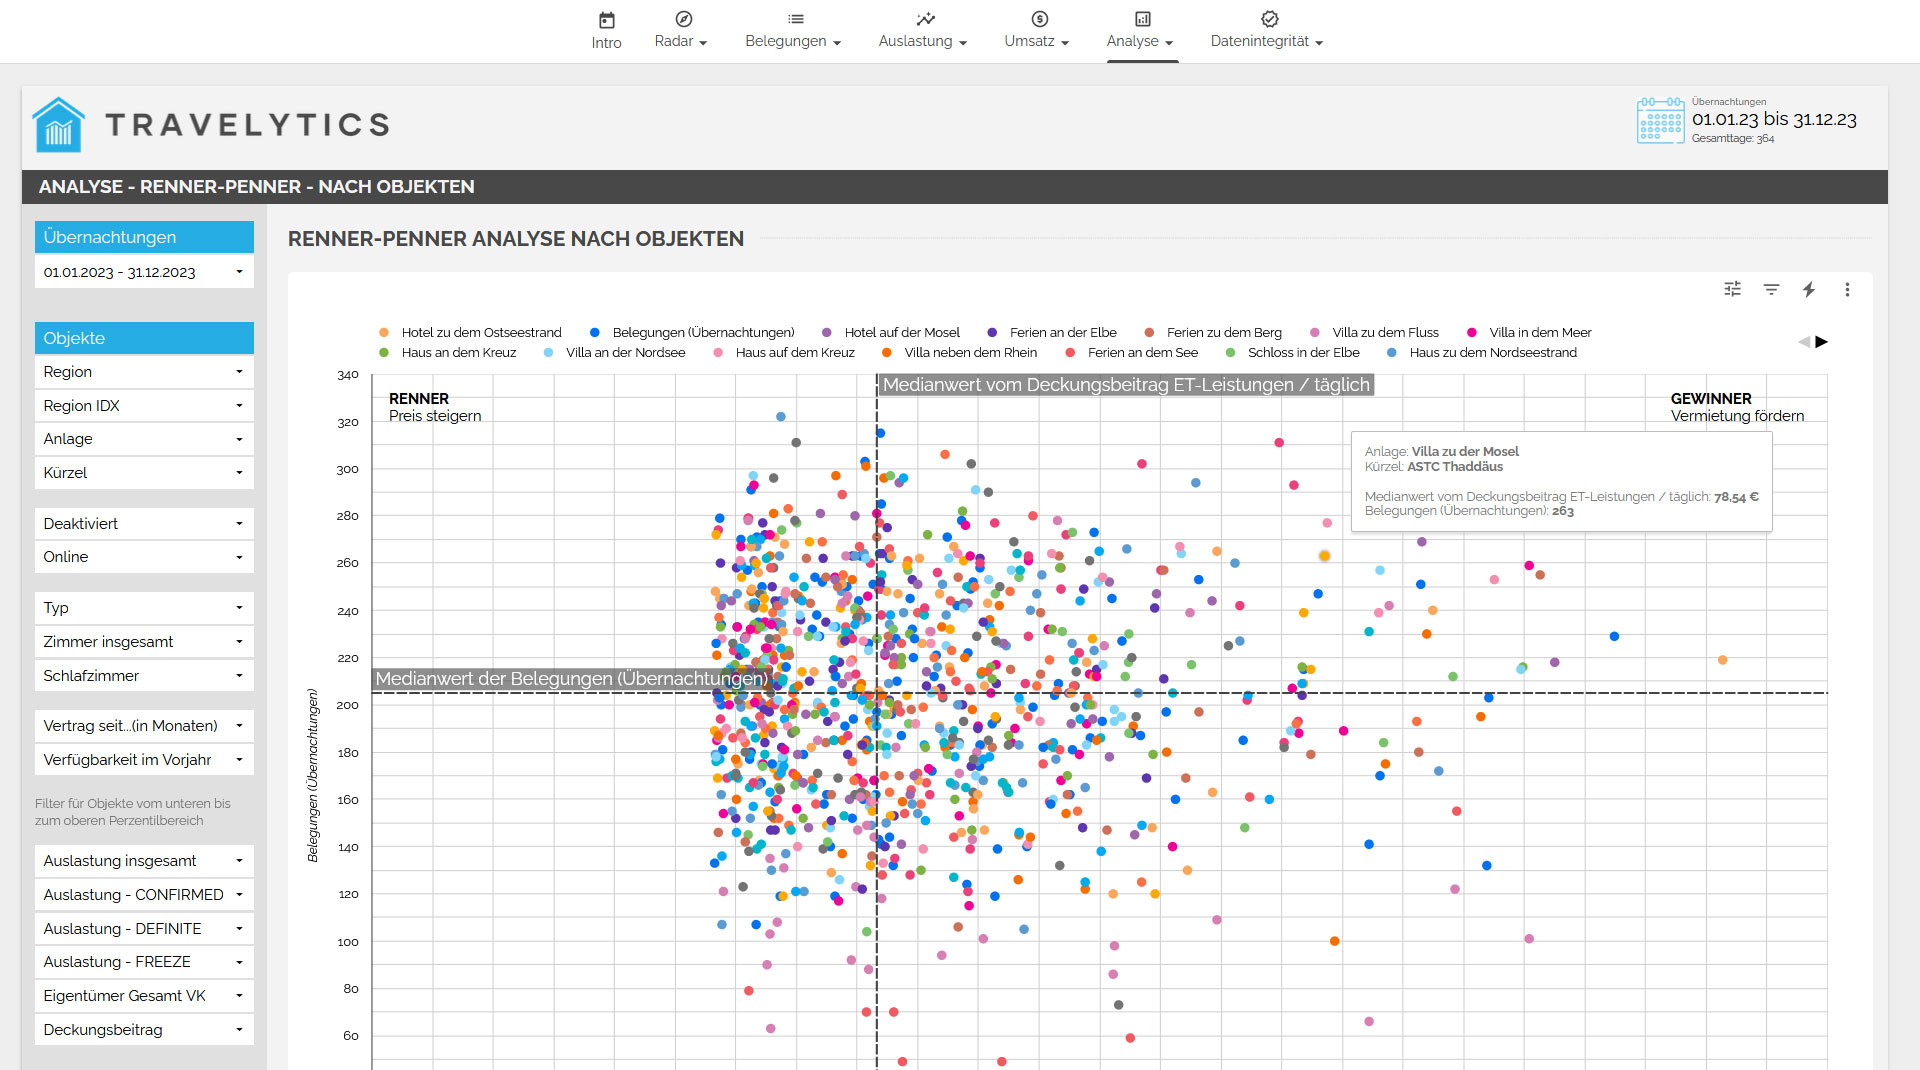
Magic Quadrant Analysis
Currently, we are conducting a Magic Quadrant analysis for a specific period of data. This analysis provides insights into which accommodations or assets have performed well or poorly during the sought-after period. It considers both the occupancy of the accommodations and the contribution margin in the form of commission. The evaluation of this analysis allows you to quickly identify areas that require attention and action.
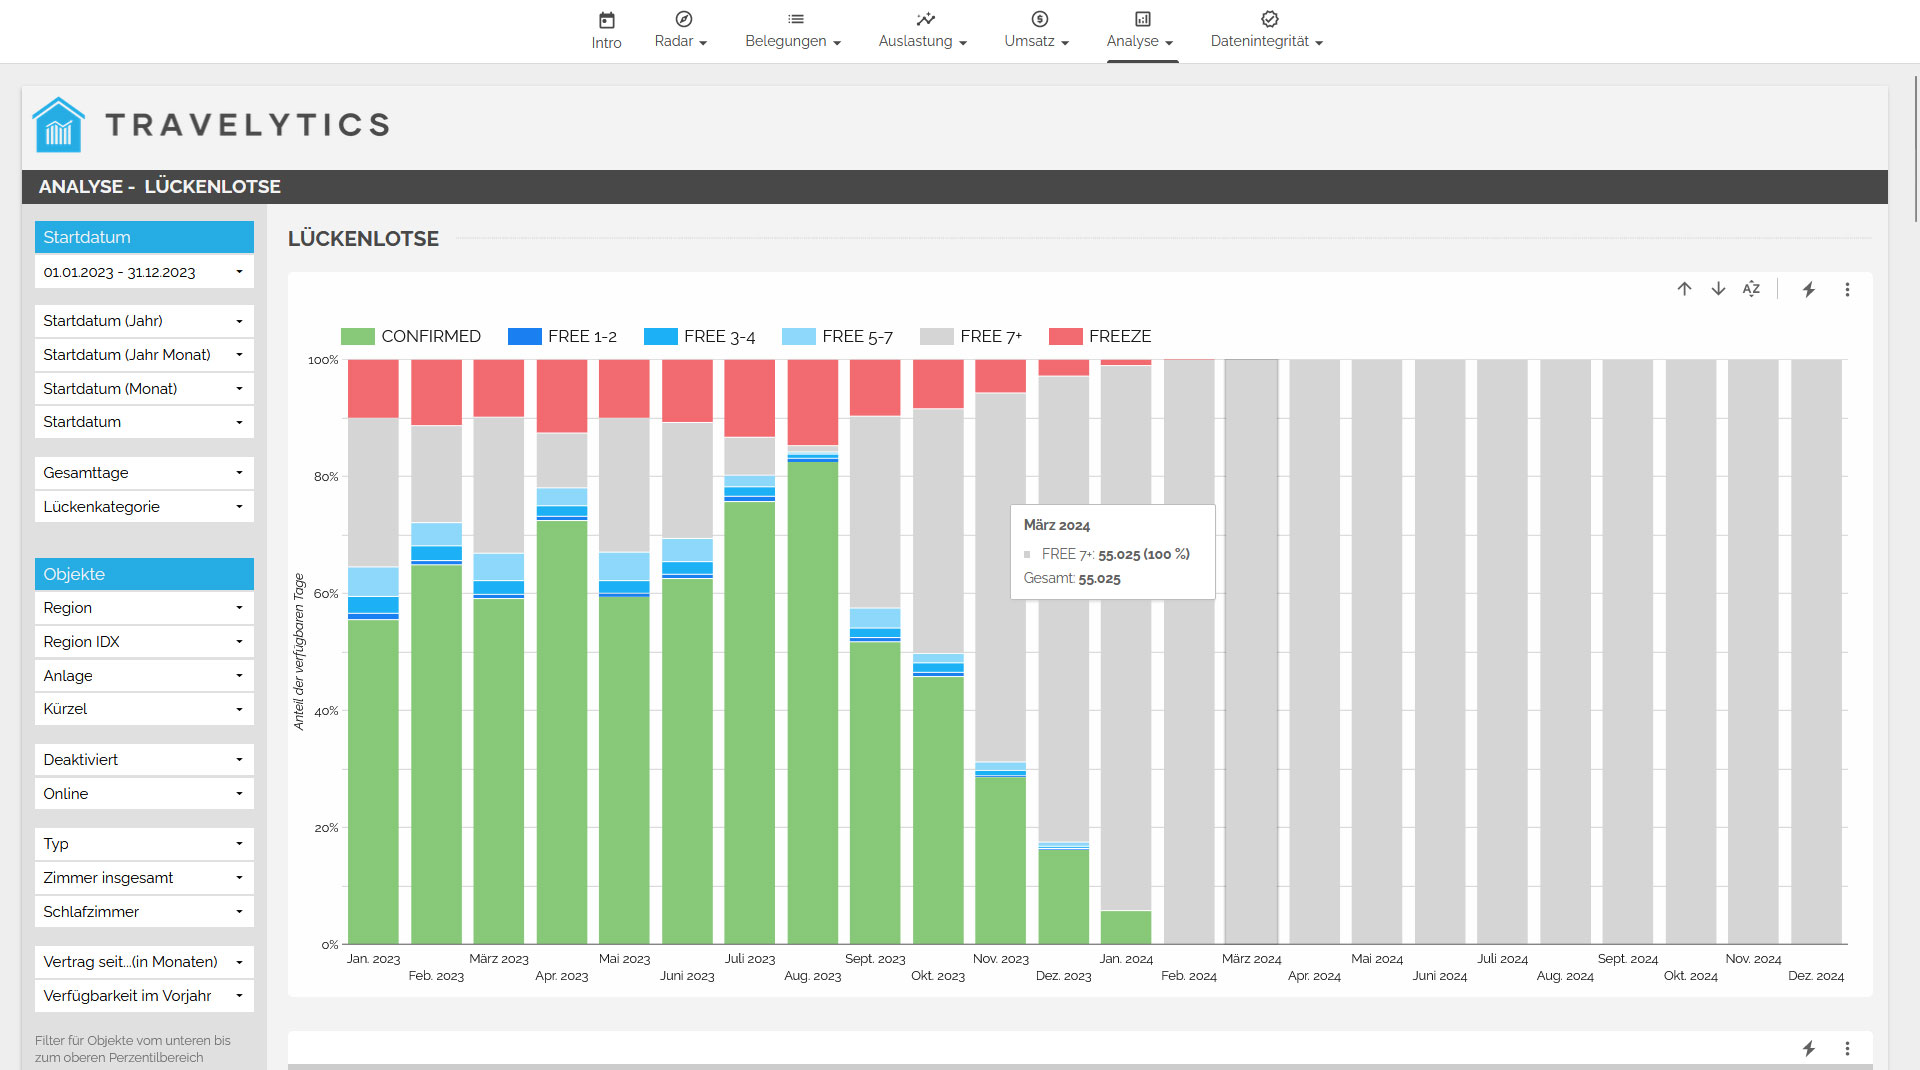
Gap Pilot - Overview of Consecutive Free Days
With the Gap pilot, we identify consecutive free days within a specified period. This overview presents both occupied periods and available gaps. The free gaps are divided into four categories: 1-2 days, 3-4 days, 5-7 days, and over 7 days. This provides a better understanding of when it's advisable to adjust the minimum length of stay or implement specific marketing measures during a particular period.
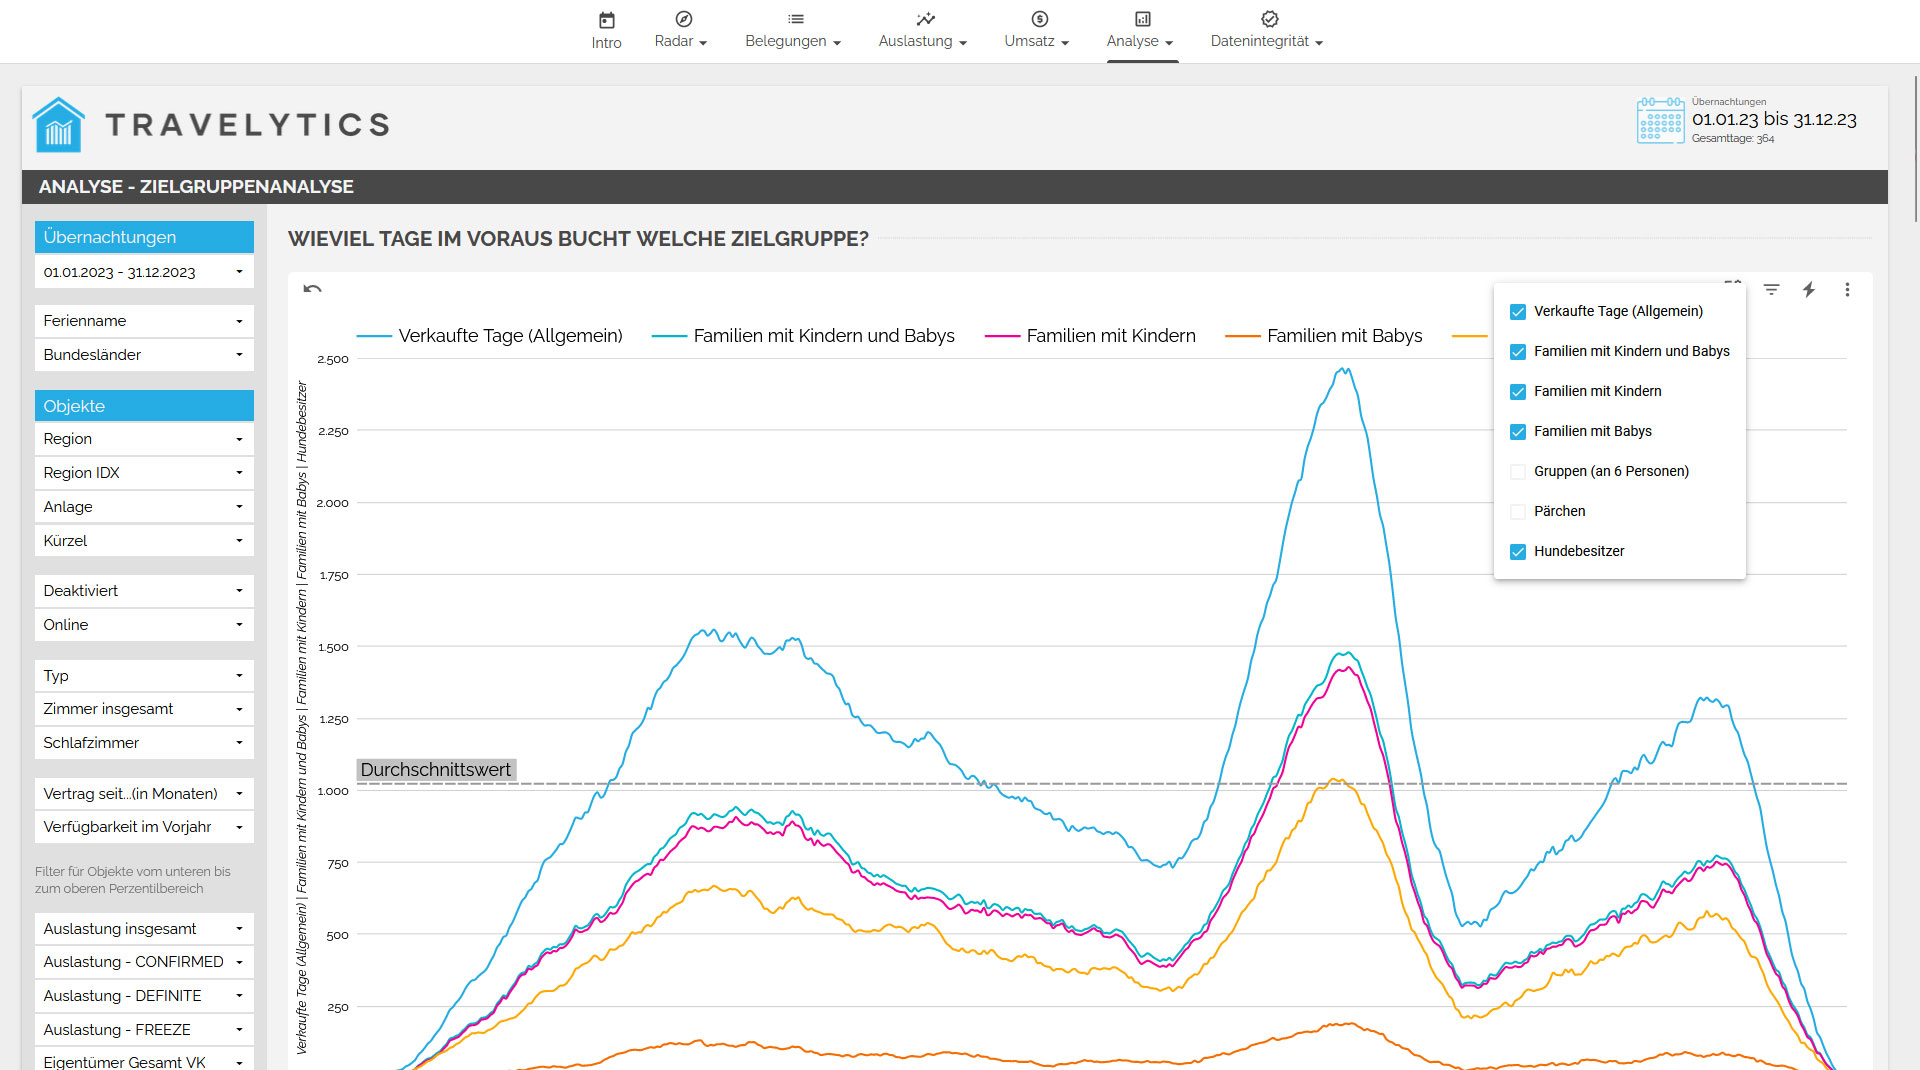
When Does Each Target Group Book?
With the target group analysis, you can examine the time span from the booking date (Reserved On) to the arrival day. You can find out when your customers book for different periods. Which group tends to make short-term bookings? Which group prefers long-term bookings? When does it make sense to run targeted advertisements for specific target groups?
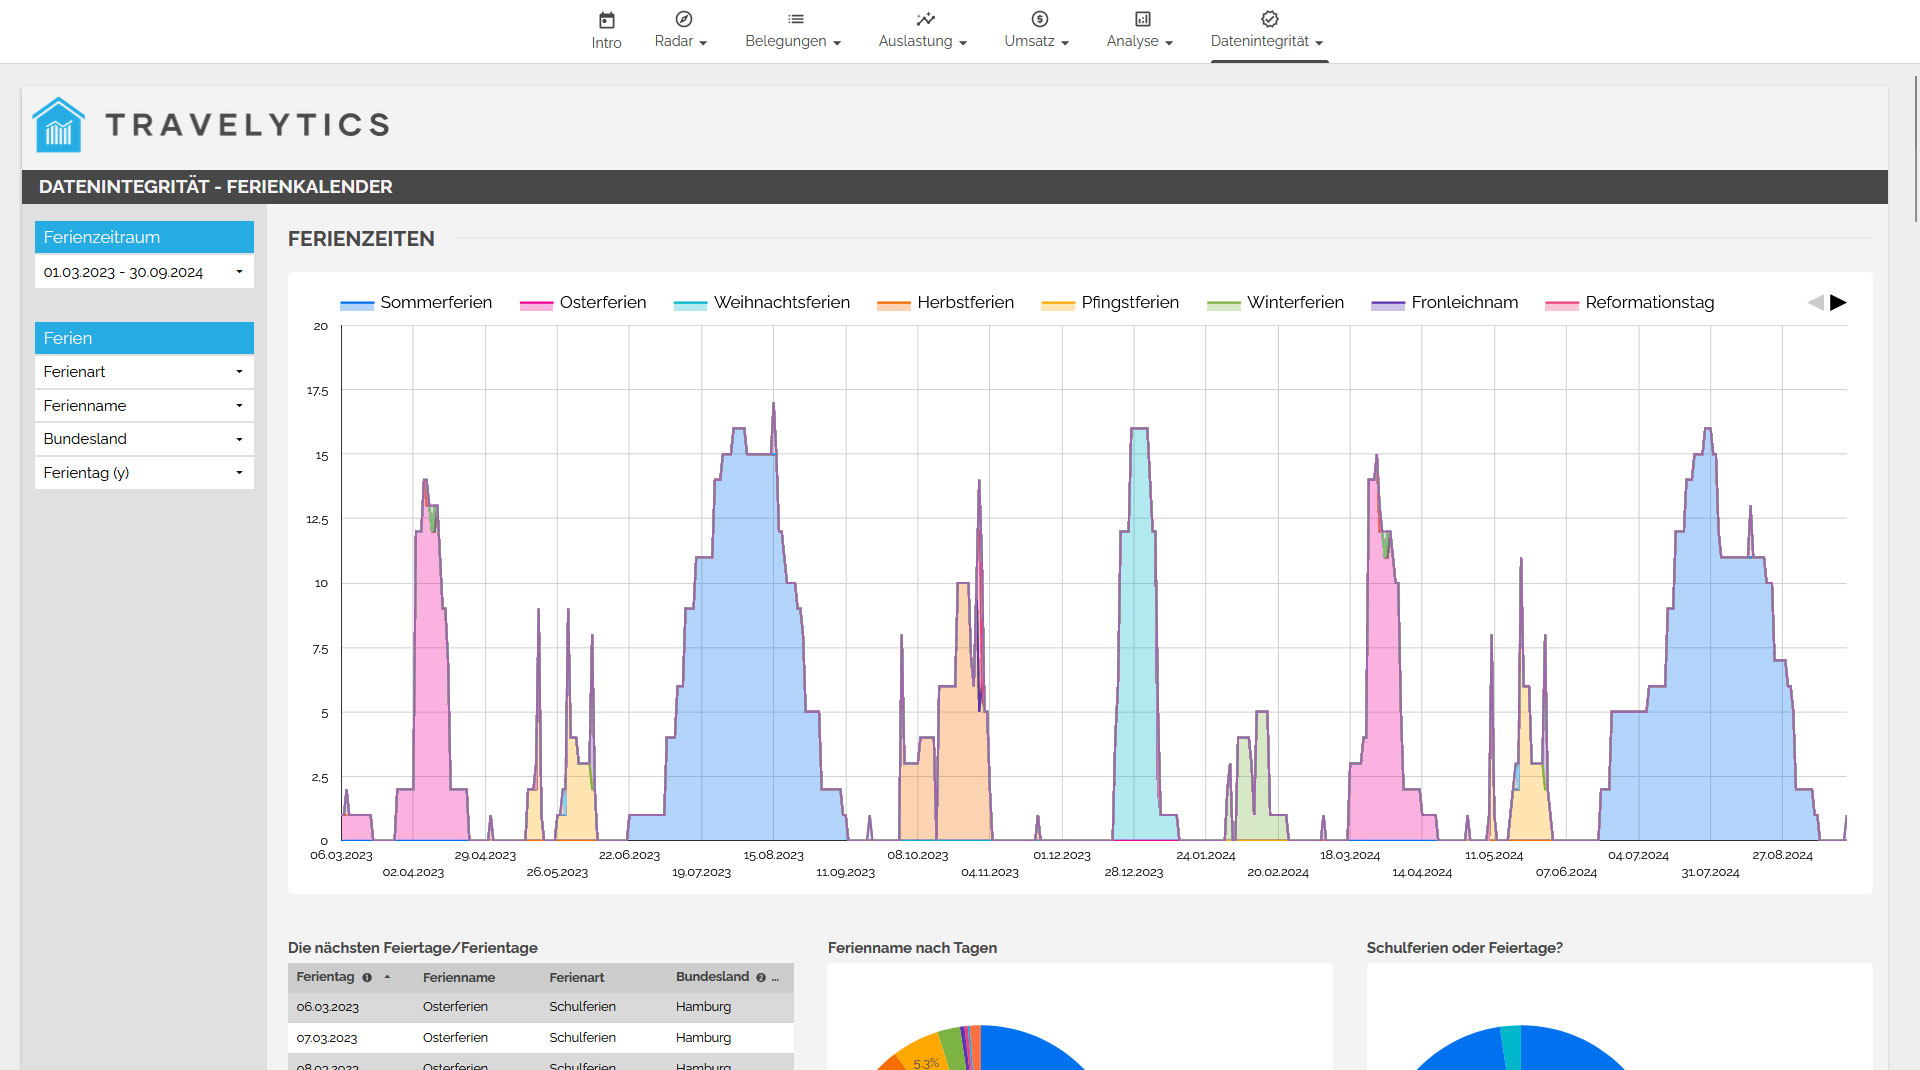
DATA INTEGRITY
In the "Data Integrity" category, we present the raw data, vacation periods, and inconsistent occupancies. Additionally, we demonstrate how we calculate the contract start and end dates if no data is provided from the system.
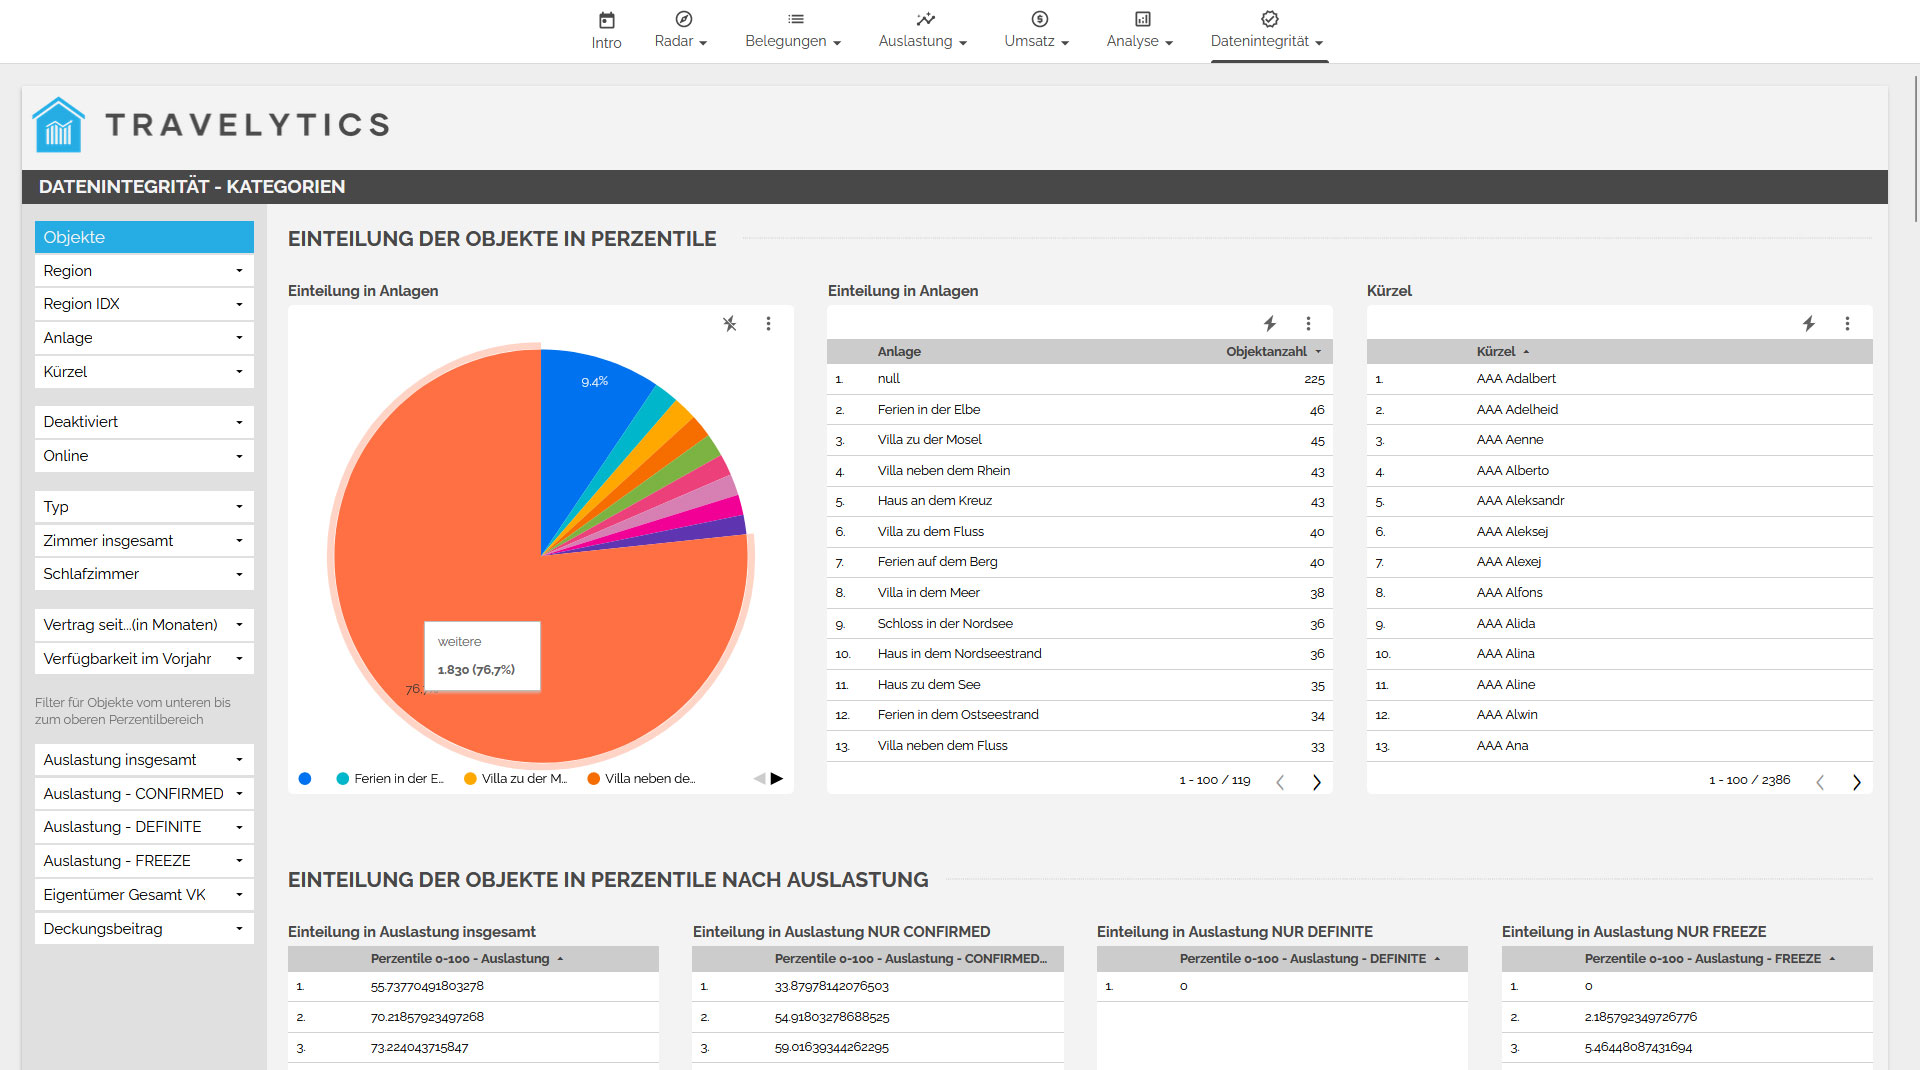
High- and Low-Performers
We apply calculations to the percentiles of the last 365 days every 24 hours and divide the objects into five categories based on that: 0-20%, 20-40%, 40-60%, 60-80%, and 80-100%. This categorization allows us to identify and filter high-performing and low-performing objects over the last 365 days. The daily re-calculation of percentiles enables us to quickly capture changes in the data. As a result, the objects can be individually categorized into different groups based on overall occupancy and occupancy fluctuations.
Maximize your profits through analysis!
Increase your profits with our powerful Revenue Management solution for vacation rental agencies. Request a free consultation now and learn how our tool can help you!
Count me in!Customers who use our Revenue Management Board